Translate this page into:
Understanding of potentization process of homoeopathic medicine of Aurum Metallicum and its characterisation
 , Ashit Kumar Pramanik3, Rajesh Chaudhary4, S. Prasanth4, Julka Kumari Tripathi5, Appu Kumar Singh1, Amreesh Chandra1, Himashu Sekhar Tiwary6, Subash Singh4, Chandra Sekhar Tiwary1,
*Corresponding author: Chandra Sekhar Tiwary, Department of Metallurgical and Materials Engineering, Indian Institute of Technology, Kharagpur, West Bengal, India. chandra.tiwary@metal.iitkgp.ac.in
-
Received: ,
Accepted: ,
How to cite this article: Kumbhakar P, Vel VK, Kumar Pramanik A, Chaudhary R, Prasanth S, Kumari Tripathi J, et al. Understanding of potentization process of homoeopathic medicine of Aurum Metallicum and its characterisation. J Intgr Stand Homoeopathy. 2024;7:4-18. doi: 10.25259/JISH_53_2023
Abstract
Objectives:
The effect of homoeopathic potentization increases with dilution. The physical and chemical properties of the homoeopathy solution change as a function of the concentration of nanoparticles (NPs). The succussion process is also vital in homoeopathy. However, none of these factors, along with the container of the medicine, have been well-researched to date.
Material and Methods:
We studied the systematic ultra-low dilution (up to 10200 times) effect of homoeopathic remedy of Aurum Metallicum (Gold) NP colloidal solution to determine the mechanism of colloidal formation in such extreme dilution. Several material characterizations were also performed to consolidate our results.
Results:
Optical spectroscopy confirmed the presence of NPs with narrow size distribution and high surface activity in higher dilution (up to 10200 times) homoeopathic solution. The particle size analysis of the serially diluted solution showed that the size distribution becomes narrow with increasing dilution. Transmission electron microscopy confirmed the presence of NPs in solutions up to 10200 times dilution.
Conclusion:
The process of dilution introduces an active hydrocarbon layer on these NPs. The experimental study further confirmed theoretical calculations. The understanding of such extreme dilutions can be utilized in biomedical applications, especially in homoeopathic medicine.
Keywords
Homoeopathy
Nanoparticles
Colloidal solution
Material characterization
Theoretical calculation

INTRODUCTION
The unique physical and chemical properties of solutions of metal nanoparticles (NPs) have been utilised for energy, water treatment, catalysis, sensor, biomedical and other applications.[1-5] Modern medical and biological research utilises NPs for numerous purposes, including biosensors, clinical chemistry, detecting cancer cells, and targeted delivery of drugs. The properties of the colloidal solution can be tuned with the help of size, morphology, composition, and NP concentration. Among all these parameters, considerable effort has been made to tune the processing conditions to increase the concentration of metallic NPs in the colloidal solution. Metal NPs are an intriguing class of colloidal materials for homoeopathy therapy. Aurum Metallicum (Aurum met) is a frequently used remedy in homoeopathic practice; it belongs to the mineral kingdom. However, the characteristics of homoeopathic medicine’s ultra-low concentration of NPs have not yet been studied. To date, there are limited studies on the process of dilution (1 bpm or ultra-dilution beyond [1015]) and its effect on different physical and chemical properties. Since 1796, highly diluted colloidal solutions have been used in homoeopathy. However, the characteristics of homoeopathic medicine’s ultra-low concentration of NPs have not yet been studied. To date, there are limited studies on the process of dilution (1 bpm or ultra-dilution beyond 1015) and its effect on different physical and chemical properties. Existing literature on homoeopathy medicines suggests that colloidal solutions are more effective with higher potentization/dilution (composed of serial dilutions and vigorous trituration/succussion beyond the Avogadro no: 1023). In the past few decades, multiple studies that revealed the presence of NPs in homoeopathic potencies have been published.[6 -17] A study by Chikramane et al.[6,9] shows the presence of starting/raw material in NPs that induce hermetic activation. Following this study, multiple types of research have been conducted to understand the complex interactions of homoeopathic medicine with its environment. The physicochemical behaviour of these NPs can be tuned using homoeopathic trituration and succussion processes. [7] Bhattacharyya et al.[8] demonstrated that the NPs enhance cellular uptake and increase bioactivity. However, the change in size and morphology of the NPs during different potencies is unexplained. Moreover, the increased effectiveness of the medicine in higher potency is not apparent.
In the present study, we processed a serial dilution of Aurum met (gold NP colloidal) using a conventional method. We chose spectroscopy and microscopy to understand the effect of serial dilution and succussion.
MATERIAL AND METHODS
Synthesis of sample
Gold (Au) of 99.9% purity was used to prepare Aurum met. The sample was prepared in glass and plastic vials following the standard protocol of Homoeopathic Pharmacopoeia, India.[15,16] The sample and procedure were performed in the HAPCO Pharmaceutical laboratory. The detailed processing step is described in the supplementary file. A schematic representation of the process steps is shown in Figure 1. Aurum met and its potencies (up to 200C in glass and plastic vials) are prepared and standardised in GMP certified company (HAPCO, Kolkata). Every measurement was performed thrice and the average result was used.
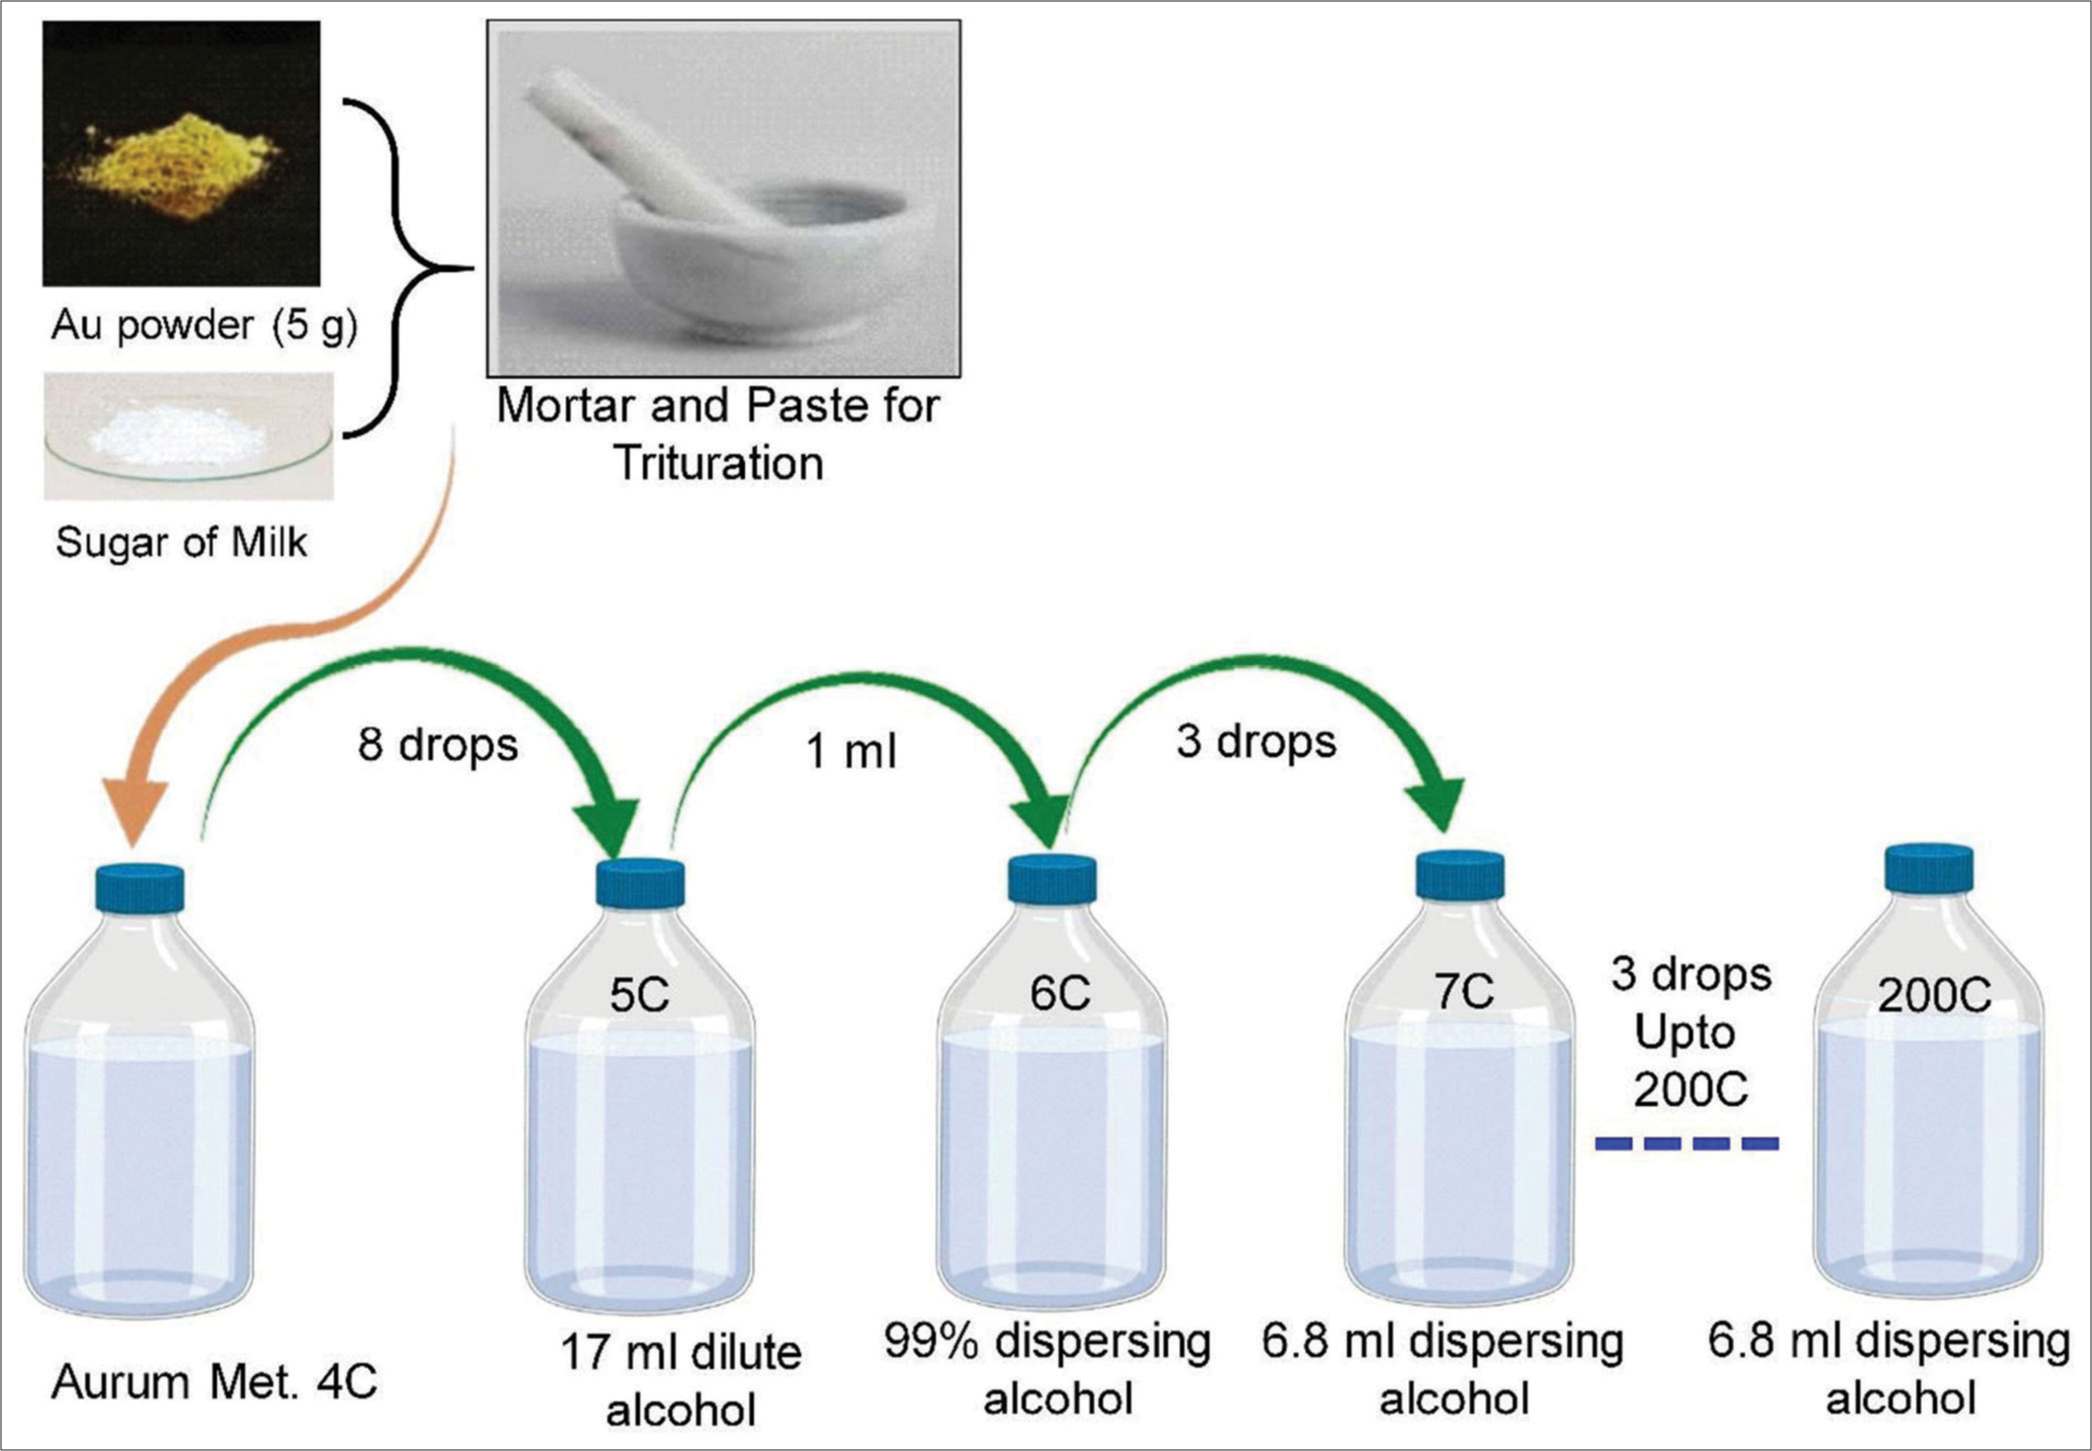
- Schematic diagram of the trituration process of homoeopathic medicine, Au: Aurum Metallicum.
Characterizations
The structural analysis of the powder sample (3X and 6X, X = powder sample potency) was performed using a PANalytical X’Pert diffractometer X-ray diffraction (XRD) with Cu-Kα incident radiation (λ = 0.15406 nm) in the scan range of 10°– 90° with a scan rate of 1°/min. Ultraviolet-visible (UV-Vis) absorption spectra (Analytical Instrument) were recorded with a double-beam spectrophotometer. Raman spectroscopy measurements were performed using the WITec UHTS Raman Spectrometer (WITec, UHTS 300 VIS, Germany) at an excitation wavelength of 532 nm. Transmission electron microscopy (JEOL JEM 2200FS) was carried out to know the particle size in the diluted sample (24C and 200C, C = Liquid sample potency). Zeta potential and particle size were measured using the Zeta and particle size analyser, respectively (Model No: Horiba Scientific SZ-100).
RESULTS
The initial solid powder samples (3X and 6X) were characterised using XRD. The colloidal suspension samples (6C–200C) were characterised using spectroscopy and microscopy techniques.
XRD pattern of triturated powder samples (3X and 6X)
To characterize (the presence of phases, size, and strain) the Au and sugar of milk (lactose) mixture during mechanical grinding, XRD analysis was performed. Figure 2a shows the XRD pattern of the powder sample with different concentrations of Au and lactose. The diffraction peaks confirm the presence of Au NPs with lactose peaks. The peak at 38° corresponds to the (111) plane of Au NPs and matches with the standard JCPDS card.[18] Along with the Au NPs peak, we also observed other peaks corresponding to lactose. Furthermore, no other impurity peaks were observed. Figure 2b shows the XRD peak of only (111) Au NPs for two different triturations (3X and 6X). For higher trituration (i.e., 6X), we observe a higher angle shift with a line broadening than 3X trituration. The shift of the XRD pattern reveals the presence of strain (~4%) in the materials. The origin of the strain is due to the mechanical grinding during trituration. We used the Debye Scherrer equation for calculating the crystalline size of samples.[19] The 3X and 6X triturated sample shows a crystalline size of ~2.6 and 2.4 nm, respectively. The reduction in crystalline size is due to the continuous mechanical grinding of metallic Au in the presence of covalently bonded lactose crystals. The mechanical grinding results in lattice strain, and after critical stress, the Au particles fracture and form nano-sized crystalline materials. It is important to note that, as per previous observations,[6,20] NPs are found in higher dilution medicine samples, but the origin of NPs formation has not been reported so far. Based on the current observation, we can see that the nanocrystalline Au NPs are formed during the trituration process itself. This highlights a unique observation that the initial preparation (starting material) for the high homoeopathic dilution is different from the other conventional medicinal preparation, which was never noticed so far, leading to erroneous conclusions.
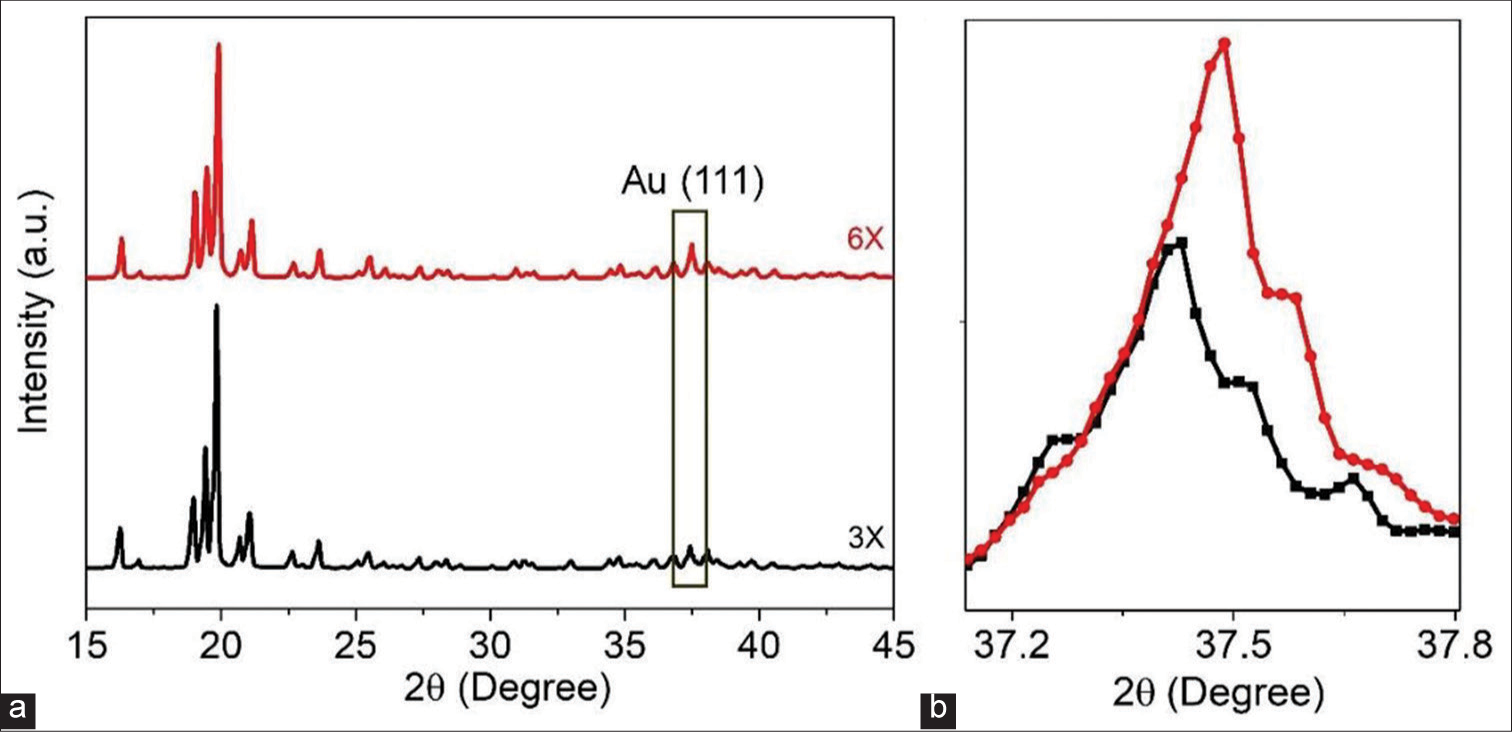
- (a) XRD pattern of power sample with two different grindings. (b) XRD peak of gold nanoparticles, Red colour: Indicates Aurum Metallicum 6X potency, Black colour: Indicates Aurum Metallicum 3X potency, XRD: X-Ray diffraction.
UV-Vis absorption spectra of liquid colloidal suspension samples (all diluted samples: 6C–200C)
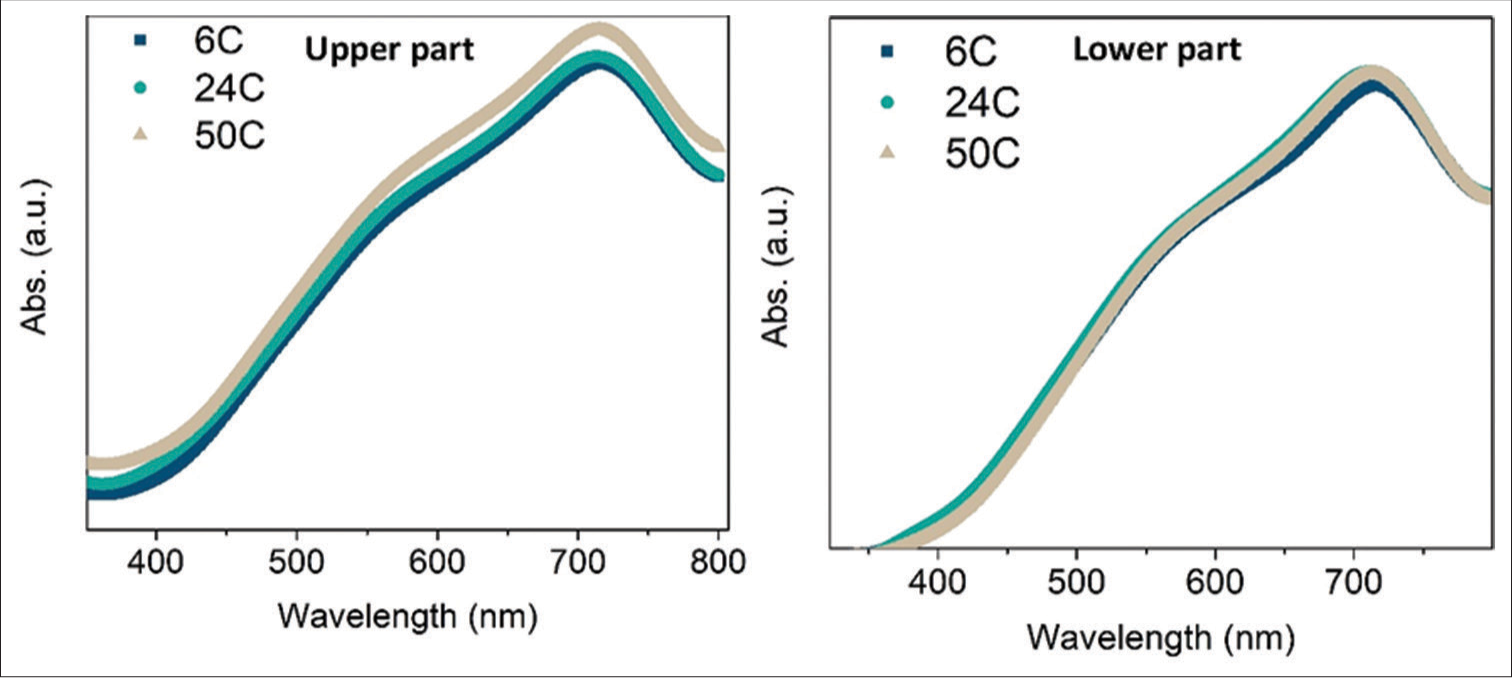
The UV-Vis absorption spectroscopy measurement is an essential tool that can provide helpful information about materials in the homoeopathic potencies (different dilutions). Figure 3a shows a schematic diagram of a borosilicate glass bottle containing homoeopathic potency. The absorption spectra of the solution have been taken from two different portions of the bottle (upper and lower part), as shown in Figure 3a. Figure 3b and c shows the UV-Vis absorption spectra of the top and bottom part solution with different potencies. The presence of three absorption bands is observed for all samples. To know the exact positions of the bands, we have plotted the second derivative of a spectrum as a function of wavelength [Figure 3d]. The occurrence of the absorption band at ~557 nm and ~721 nm is due to the presence of an anisotropic structure of different-sized Au NPs with localised surface plasmon resonance (LSPR).[3,21] In addition, it shows the shape and absorption intensity of the spectra change with potencies. A broad absorption band has been observed at higher potency (i.e., concentration-106 –1017 times dilution), which gradually became narrow/sharp after 24C. Similar variation has been observed for both the upper and lower part of the potencies.
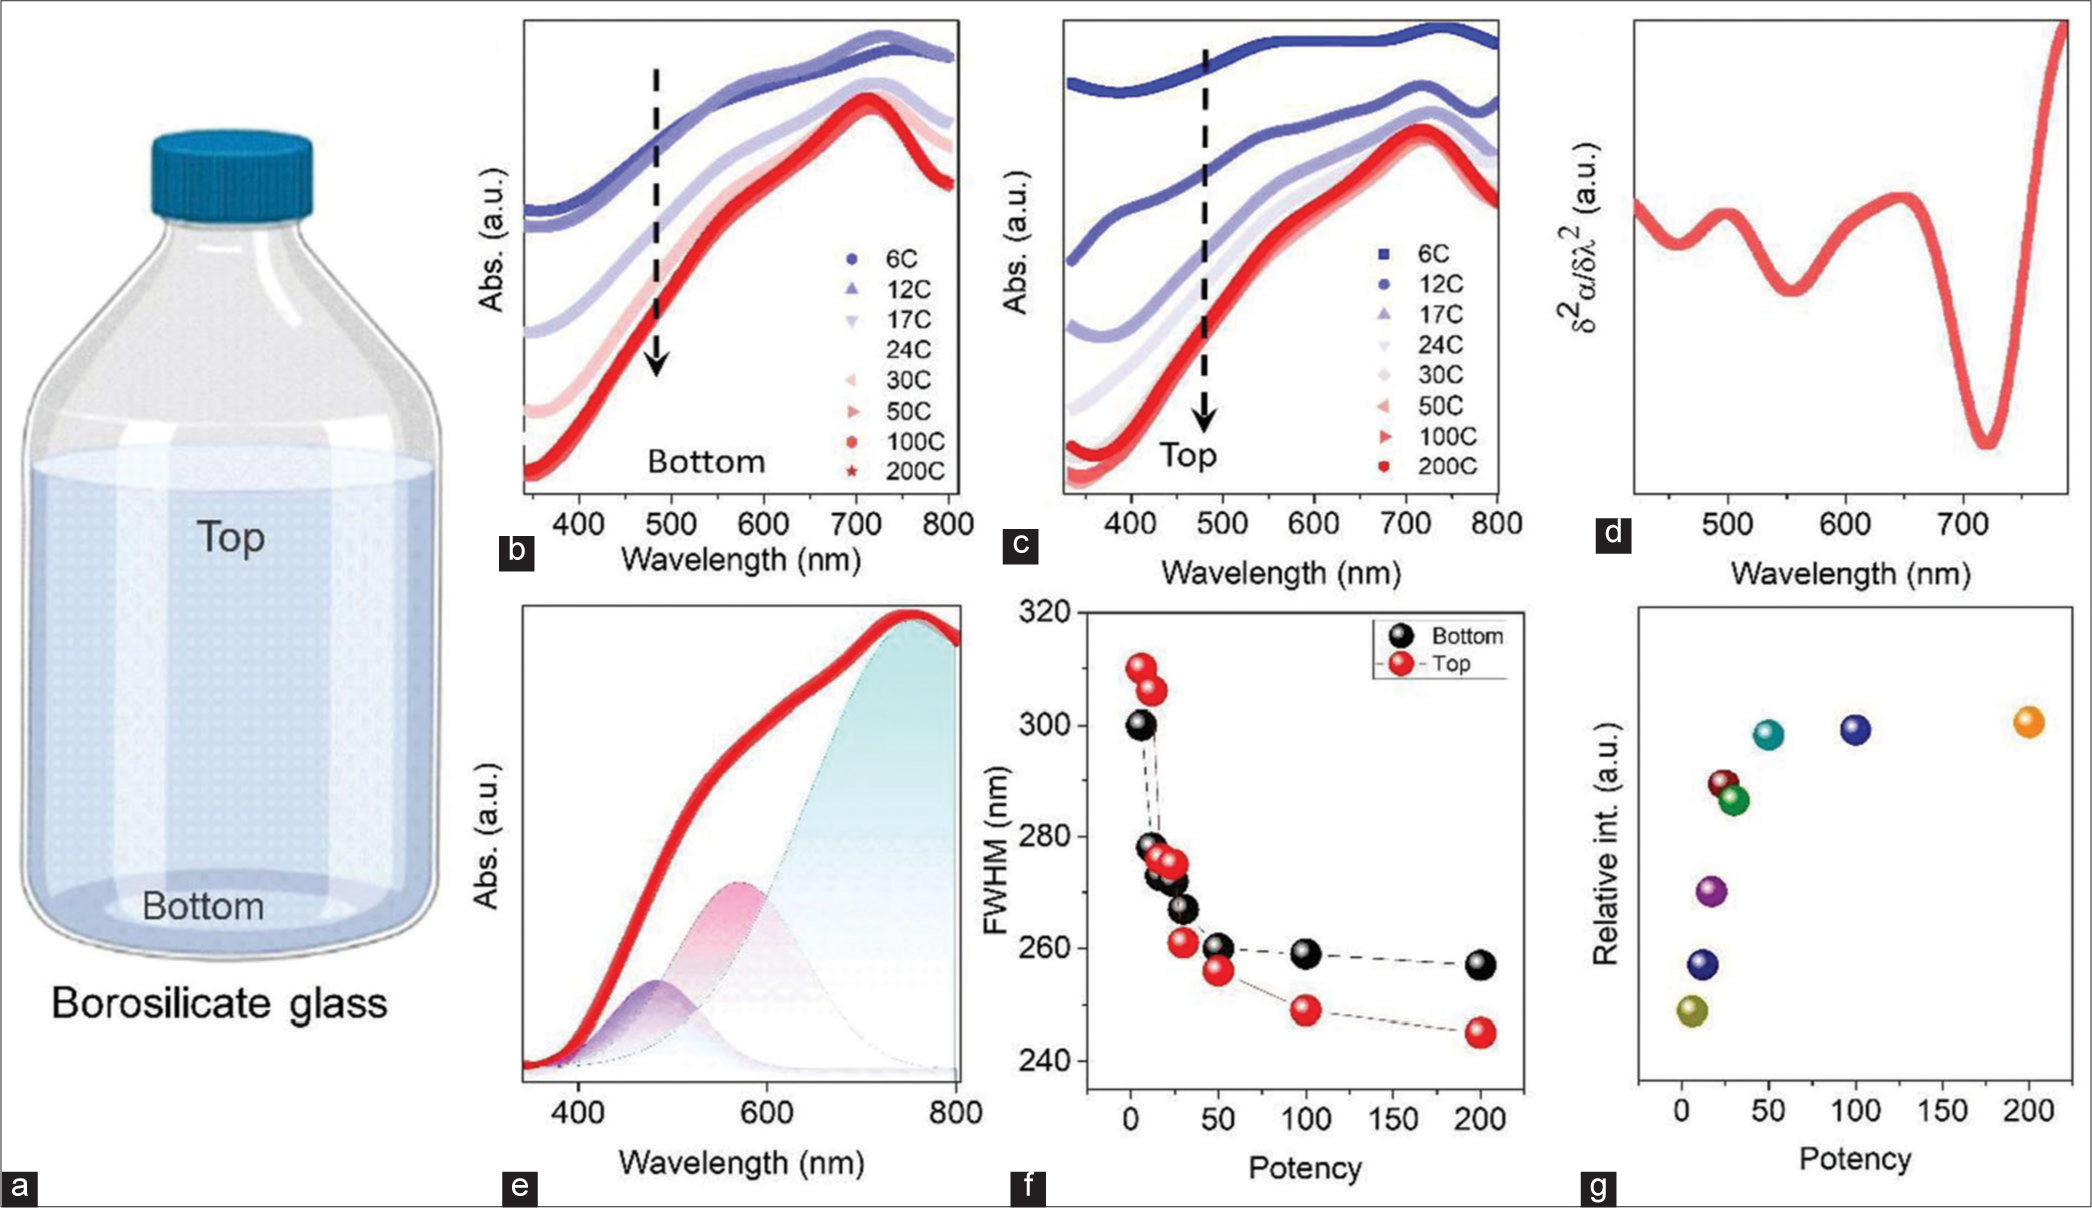
- (a) Schematic representation of a sample bottle with liquid dispersion. Ultraviolet-visible absorption spectra of the sample with different dilutions. Samples are taken from the bottom (b) and bottom and top (c) parts of the borosilicate glass bottle. (d) Second-order derivative of the absorption spectra as a function of wavelength. Indicates the presence of localised surface plasmon resonance and different oscillation modes of Au nanoparticles. (e) Baseline corrected fitted absorption spectra with three Gaussian peaks of the 200C sample. (f) Variation of full-width half maximum as a function of dilution at two different portions of the bottle. (g) Variation of the relative intensity of absorbance of gold nanoparticles.
The obtained absorption spectra have been fitted by the Gaussian multiple peak fitting method to know the presence of NPs in the potencies [Figure S1]. A representative Gaussian fitted plot of 6C potency is shown in Figure 3e, and other diluted samples are shown in supporting figures. From the fitting, we have observed that three major peaks are present. The first broad peak, at ~300–450 nm, is associated with the presence of silicates ([SiO4]4-) with the hydrocarbon chain. Previously, it was reported that the origin of silicates is the chemical reaction between ethanol solution and sodium silicate, which discharge from the borosilicate glass bottle.[7] We also measured the UV-Vis absorption spectra of the samples kept in plastic bottles to validate the results. The absorption peak is absent in samples processed in plastic bottles; the details are described in the supporting information [Figure S2]. The other two peaks originate due to the LSPR of Au NPs. The narrowing of the absorption peaks in the absorption spectra [Figure 3a and b] of the samples indicated the relatively narrower size distribution of the Au NPs. To know the exact origin of the narrowing of the Au absorption edge, we have plotted the full-width half maximum (FWHM) as a function of potencies, as shown in Figure 3f. The FWHM decreases with increased potencies, which means the deviation in Au NP size distribution decreases with higher potency. The distribution of particle size is different for the top and bottom parts of the container.
Moreover, the Au NPs size variation is different for the top and bottom parts of the potency, as shown in Figure 3f. The absorption peak of Au NPs becomes more prominent in the higher potency samples, as shown in Figure 3g. Hence, we can conclude that the ratio of Au NP to lactose increases as the potency increases. The three critical observations during these current characterizations are as follows:
The distribution of particles is not uniform across the triturations (top and bottom parts are different)
The distribution of the particles changes as a function of potency
The ratio of Au/lactose increases due to homoeopathic potentization.
The succussion process was studied in detail using optical measurements. The UV-Vis absorption spectra have been taken in different succussion for different potencies. A representative spectrum of 200C potency after different succussions is shown in Figure 4a; other spectra are shown in supplementary file [Figure S3]. Figure 4a(I) shows an enlarged view of the first absorption band (~210–260 nm), denoted as I. The peak intensity increases with the increase of succussion. This peak is due to the presence of hydrocarbon sources in the solution.[22,23] [Figure 4a(II)] presents the second absorption band, as denoted II, and this band also shows similar nature as the succussion number increases; peak intensity increases. This peak originated from the aromatic π-system and hydrocarbon chain with silicate.[23] During the succussion process, the lactose layers disintegrate and lead to an increase in hydrocarbon-silicate groups. In Figure 4a(III), we present the absorption spectra of Au NPs as a function of succussion. The intensity of Au NPs peak increases as a function of succussion. The layers of lactose dissolve in the solvent (water/alcohol mixture) during the process, leading to exposure of the NP surface. Based on the absorption spectra, the absorption intensity was calculated for different potencies (6C, 50C, and 200C) as a function of succussion, as shown in Figure 4b-d. It shows that the absorption intensity (defined as P1 and P2) increases with succussion. The trend remains similar for different potencies (6C, 50C, and 200C). Therefore, in subsequent succussion, the fraction of active NPs (surface of NPs without the lactose matrix) increases, stimulating the response of the medicines in human health.
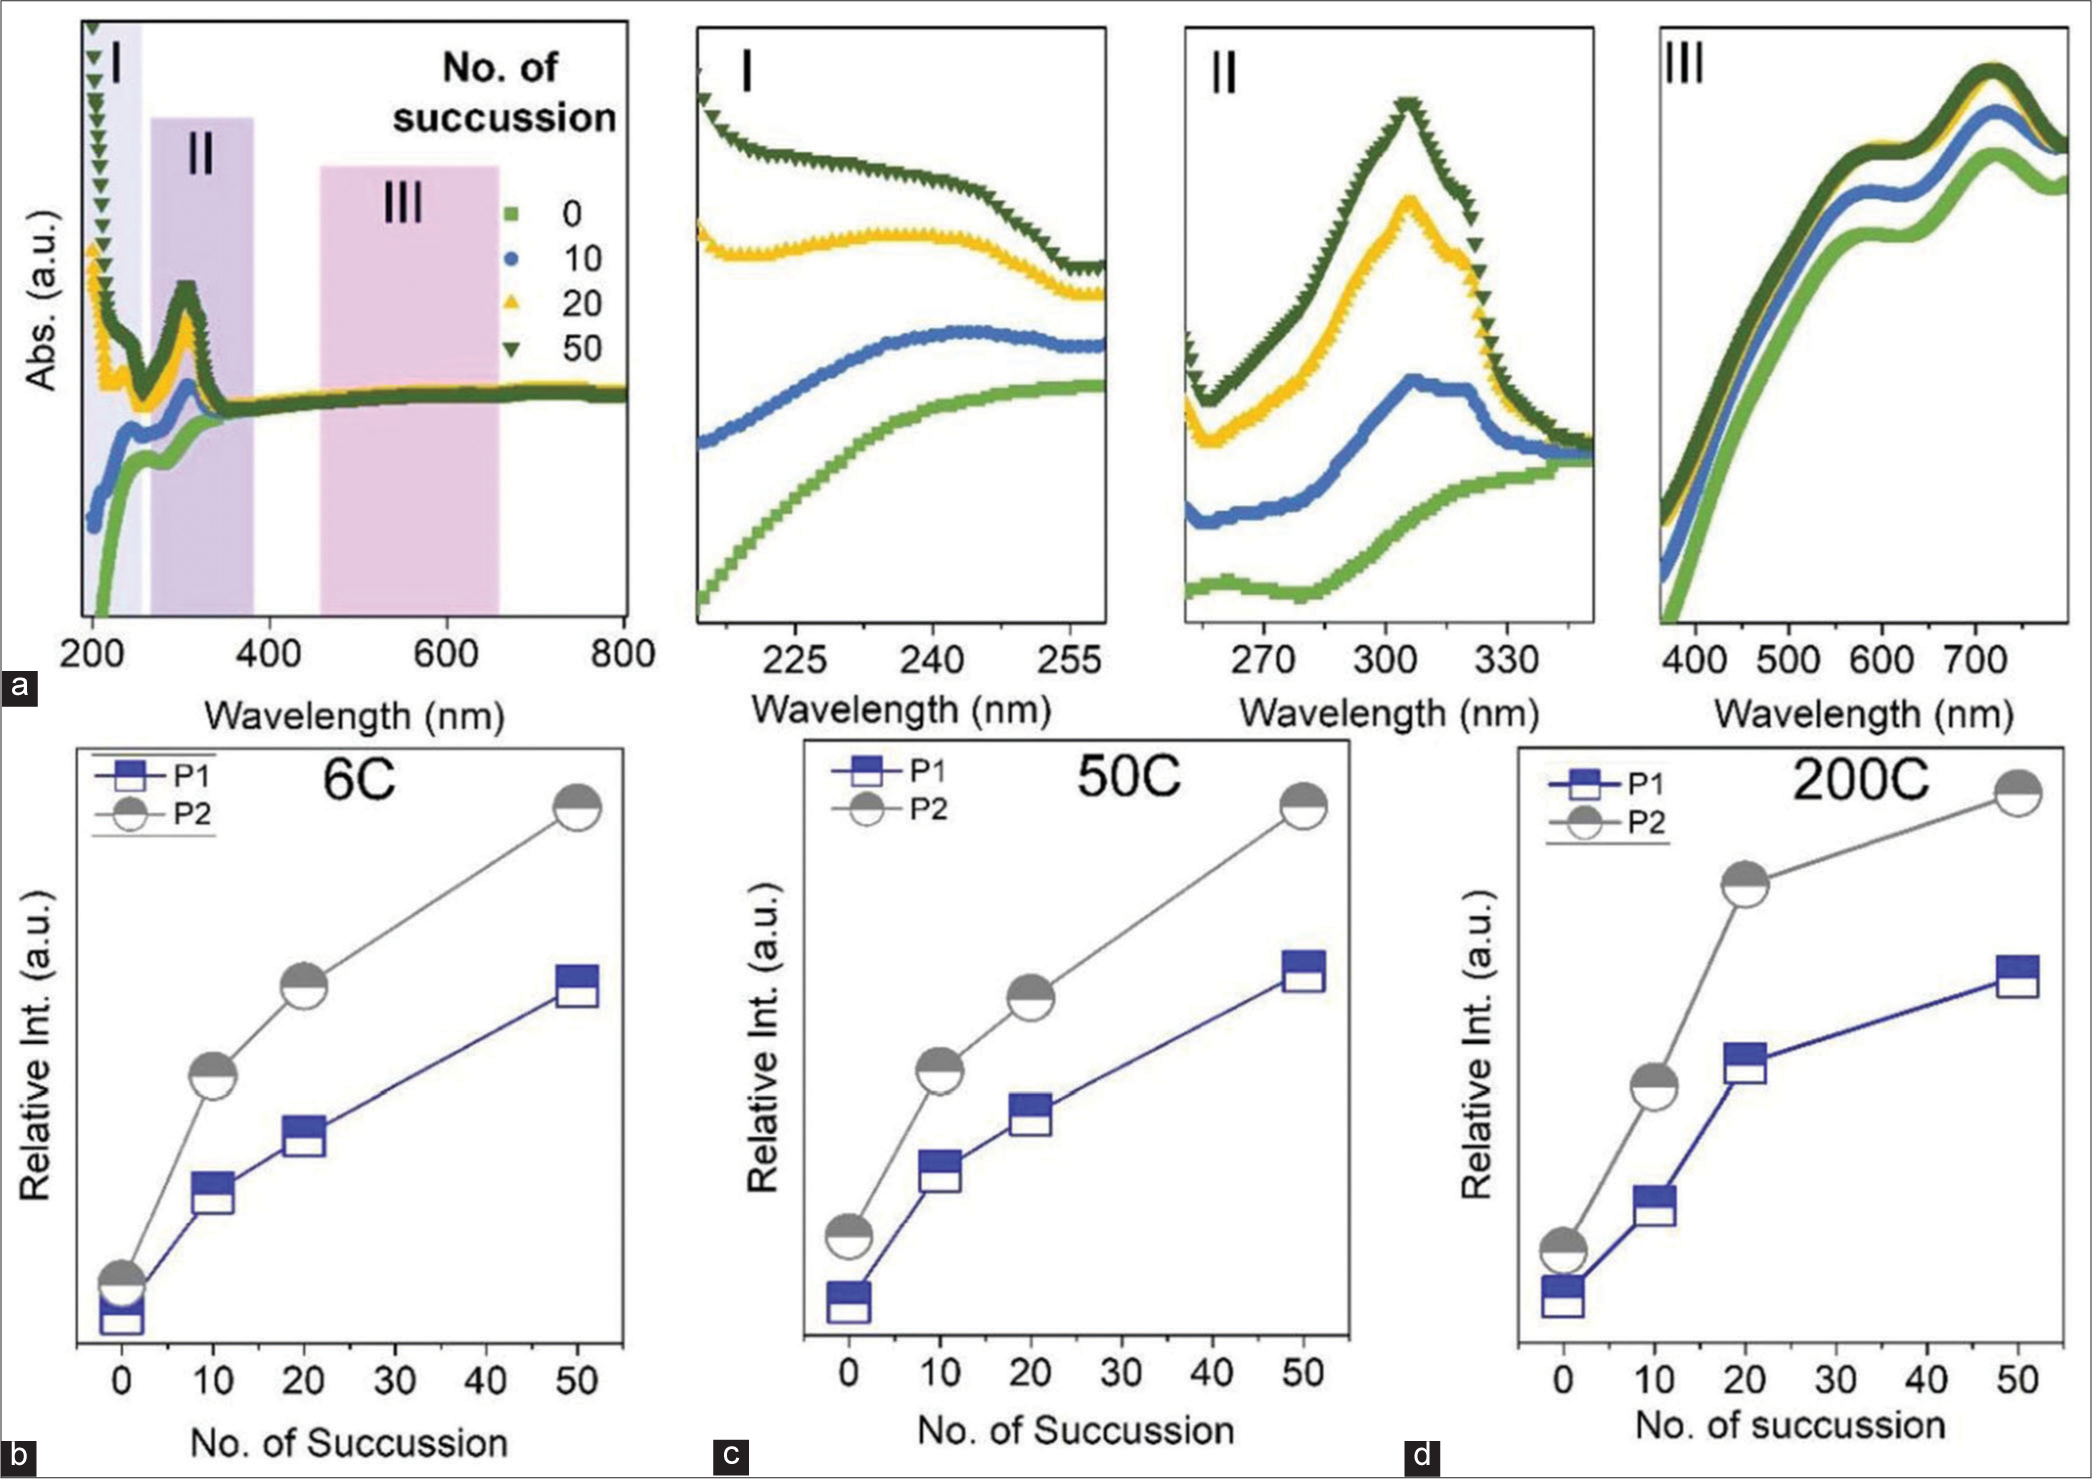
- (a) Ultraviolet-visible absorption spectra of the sample (200C) after and before succussion. I, II and II show the enlarged portion of the marked area. I, II and III denotes three different region in the absorption spectra. Region I denotes the first absorption band and the peak intensity increases with succussion. Region II denotes the second absorption band originated from hydrocarbon-silicate groups. Region III denotes absorption band of Au NPs and the peak intensity varies with succussion. The variation of absorption intensity of Peak I (P1) and Peak II (P2) for (b) 6C, (c) 50C and (d) 200C samples as a function of succussion.
Particle size and zeta potential analysis
Quantitative measurement of NPs present in the different potencies is performed using dynamic light scattering (DLS), as shown in Figure 5a-d. As described earlier, we took the solution in two parts of the borosilicate glass bottle (top and bottom) to measure particle size distribution. Most of the particles are in the size of ~200–600 nm (upper portion of the glass bottle) [Figure 5a]. However, primarily large particles (~6 µm) are found [Figure 5b]. The particle size distribution decreases (size range of particles present) as the potency increases. It is important to note that at lower potency, the size distribution of particles in the solution is non-uniform (top part). However, after a particular potency, it shows a more uniform size of NPs. Therefore, potentization results in solutions with smaller particles, which improves the effectiveness of the medicine on human health. In addition, the size distribution for the lower part sample is similar for all potencies. Hence, we take the solution from the top part during the potentization process, that is, smaller particles. We have also measured the particle size in different succession, as shown in Figure 5c and d (upper and lower parts of the borosilicate bottle).
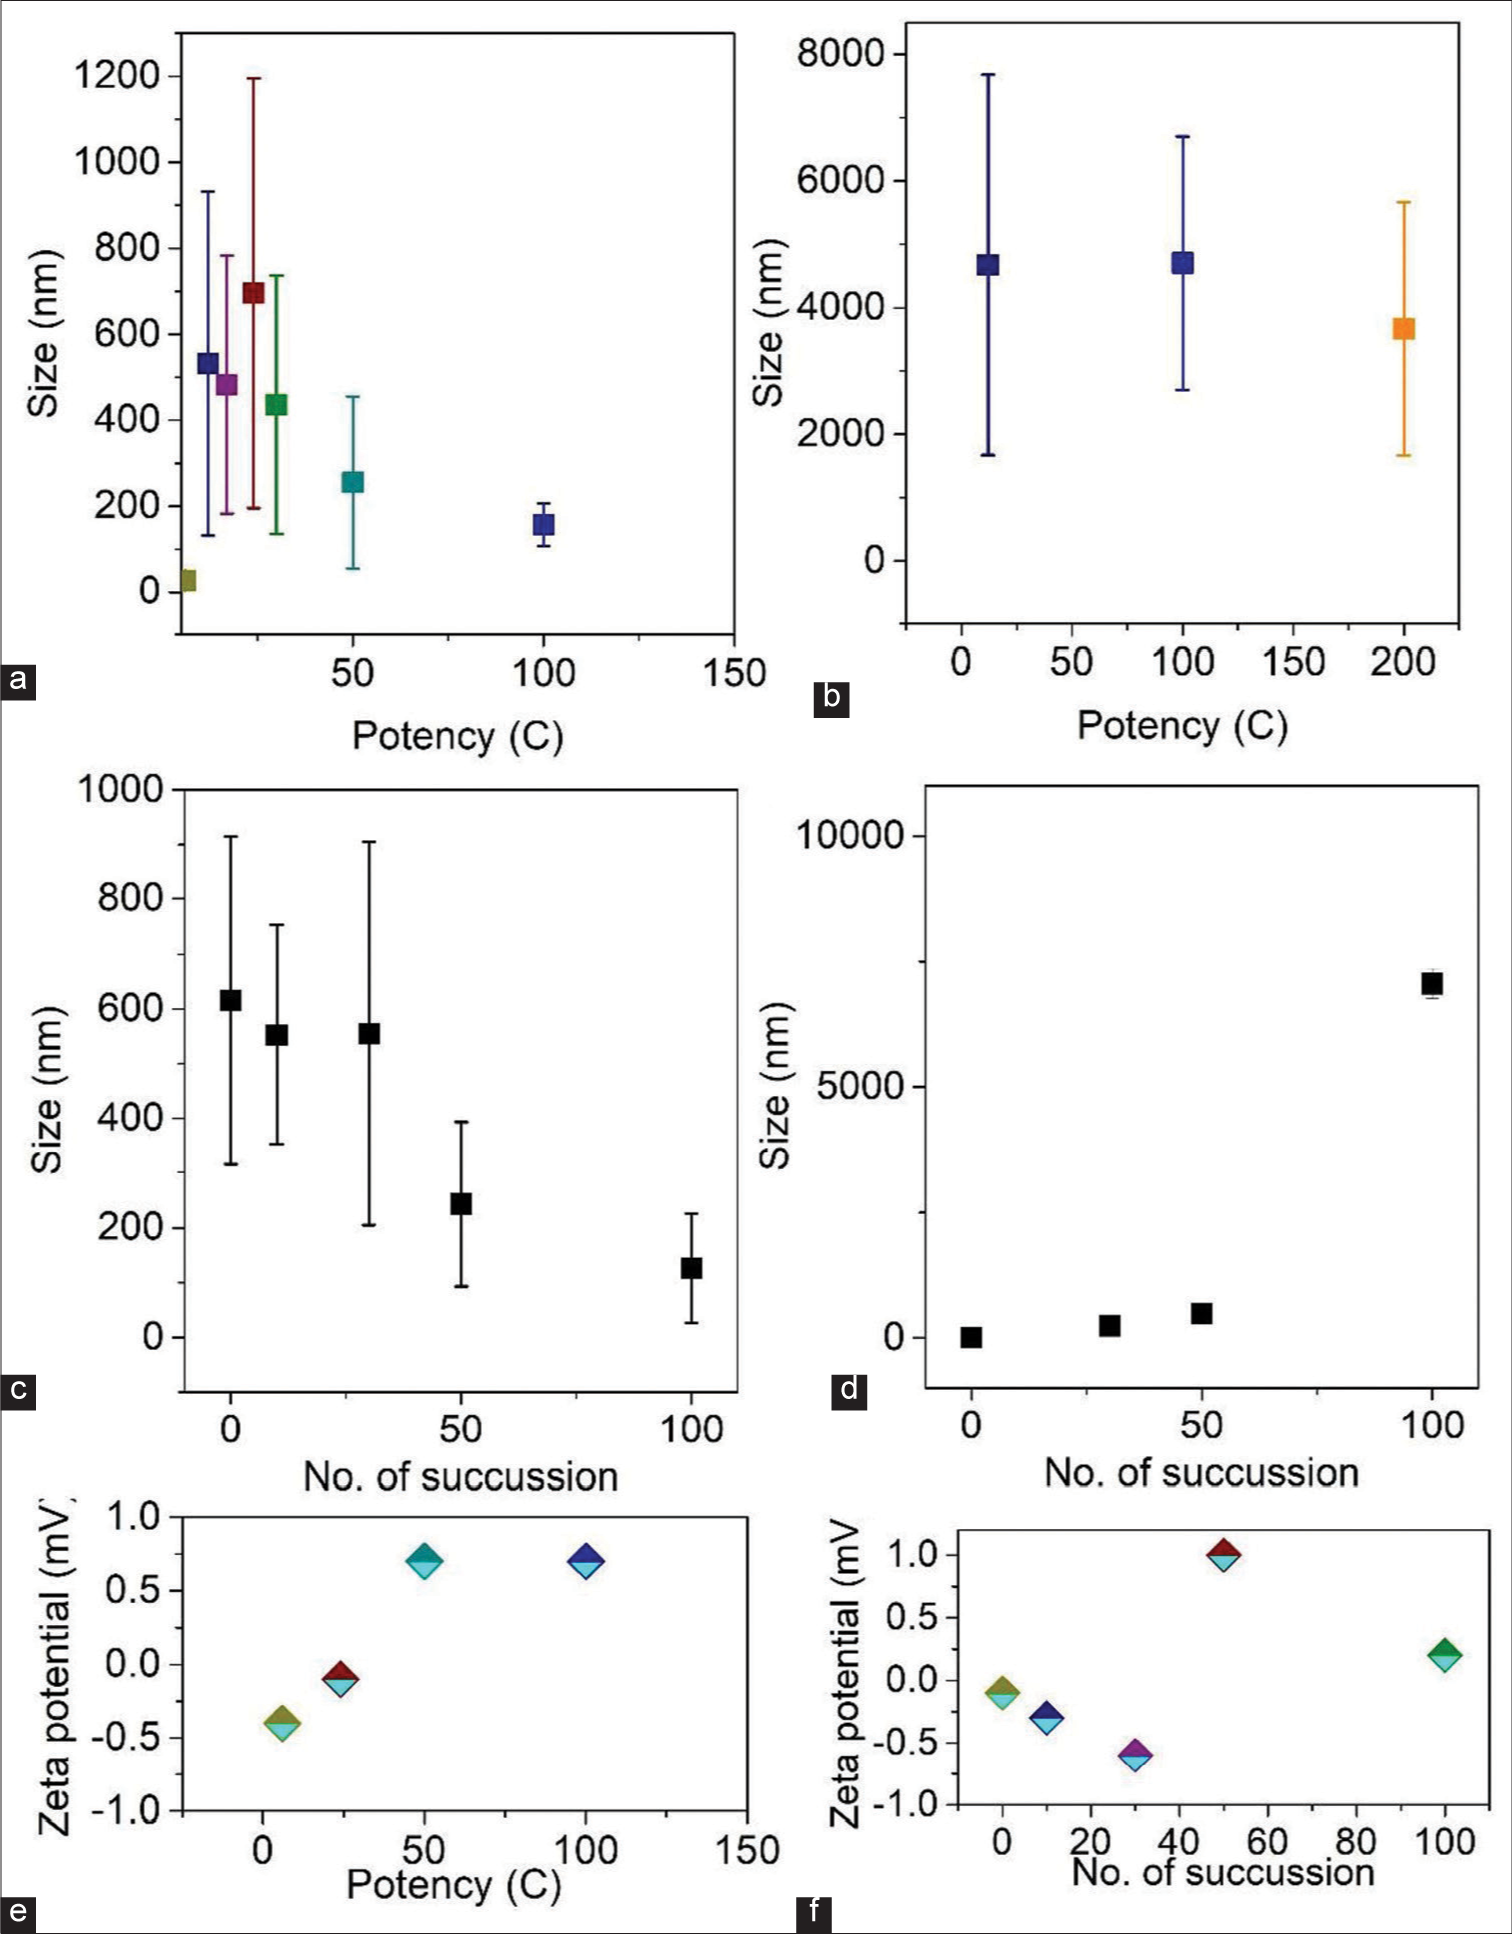
- The variation of particle size in two different positions of the sample container (a) Top and (b) Bottom, respectively. Variation of particle size after different succussions in blank solution in (c) Top and (d) Bottom portion. (e) Zeta potential of all the diluted samples. (f) Variation of zeta potential with succussions.
Interestingly, we have seen that in the upper part of the bottle, the average size of the particle decreases with an increase in the succussion number. Hence, more active NPs are exposed to the surface. However, in the lower part, the size of the particle increases with succussion during potentization. This result indicates increased air-bubble formation and a mixture of NPs with bubbles. Zeta potential is also an essential parameter for knowing the stability of colloidal systems. It also helps to quantify the surface charge of the particle. The zeta potential of all potency has been measured using the Zeta analyser measurement system, as shown in Figure 5e and f. The plot of zeta potential as a function of potency shows a change in the value from negative to positive, which means the nature of the solutions is unstable. Such experimental values suggest the un-stability of the solution, that is, the activity of the charged particles changes during succussion and potentization, which is consistent with our optical measurements.
TEM and Raman measurement of low and high diluted sample
The above discussions are, further, supported using the TEM study, as shown in Figure 6. Here, two different potencies (low and high) are used to understand the formation of thin layer and chemical composition of the particles. Figure 6a-c shows the TEM and high-resolution TEM (HRTEM) images of a low-potency sample with different sizes. Figure 6b shows that the Au NPs are distributed on the silicate chain with the hydrocarbon layer. The silicate chains are assembled from the discharge of silicate from the borosilicate bottle. With gradual dilution, the lactose disintegrates and forms a hydrocarbon layer. The HRTEM image of Au NPs, shown in Figure 6c, confirms the crystalline nature of the NPs. However, well-separated monodispersed Au NPs are observed in higher potency, as shown in Figure 6d-g. Figure 6e and f shows a single particle of Au coated with a thin silicate chain and hydrocarbon layer. HRTEM image shows [Figure 6e] that the surface of Au NPs is affected by electron beam irradiation. These results confirm that the surface of Au NPs is more reactive at a higher potency. In Figure 6g, we present the reactive edge of the Au NPs. We have also schematically presented the TEM observation in Figure 6h and i. It is observed that a layer of hydrocarbon and silicate is formed at low potency, and the Au NPs are embedded/encapsulated on that. However, the layer may disintegrate after trituration and form a thin coating on every NP. In addition, at very high potency, the surface of the particles is more active, and this active surface can react with humans. We have also taken the Raman spectra of different samples to confirm our assumption, and obtained results are well-matched with the TEM results. As shown in Figure 6j, the Raman vibrations are well-matched with previously reported data.[24] It is found that several Raman peaks have appeared related to sucrose, lactose and glucose, which strongly supports the TEM results. In addition, it was found that the intensity of the Raman peaks varied with dilution. Previously, it was reported that the Raman intensity strongly depends on the sample concentration when other excitation source parameters are constant.[25] Therefore, this clearly indicates effective silicate coating with a hydrocarbon layer on Au NPs. The spectra show that lactose/fructose/glucose molecules firmly stabilize the Au NPs by layer over the NPs.
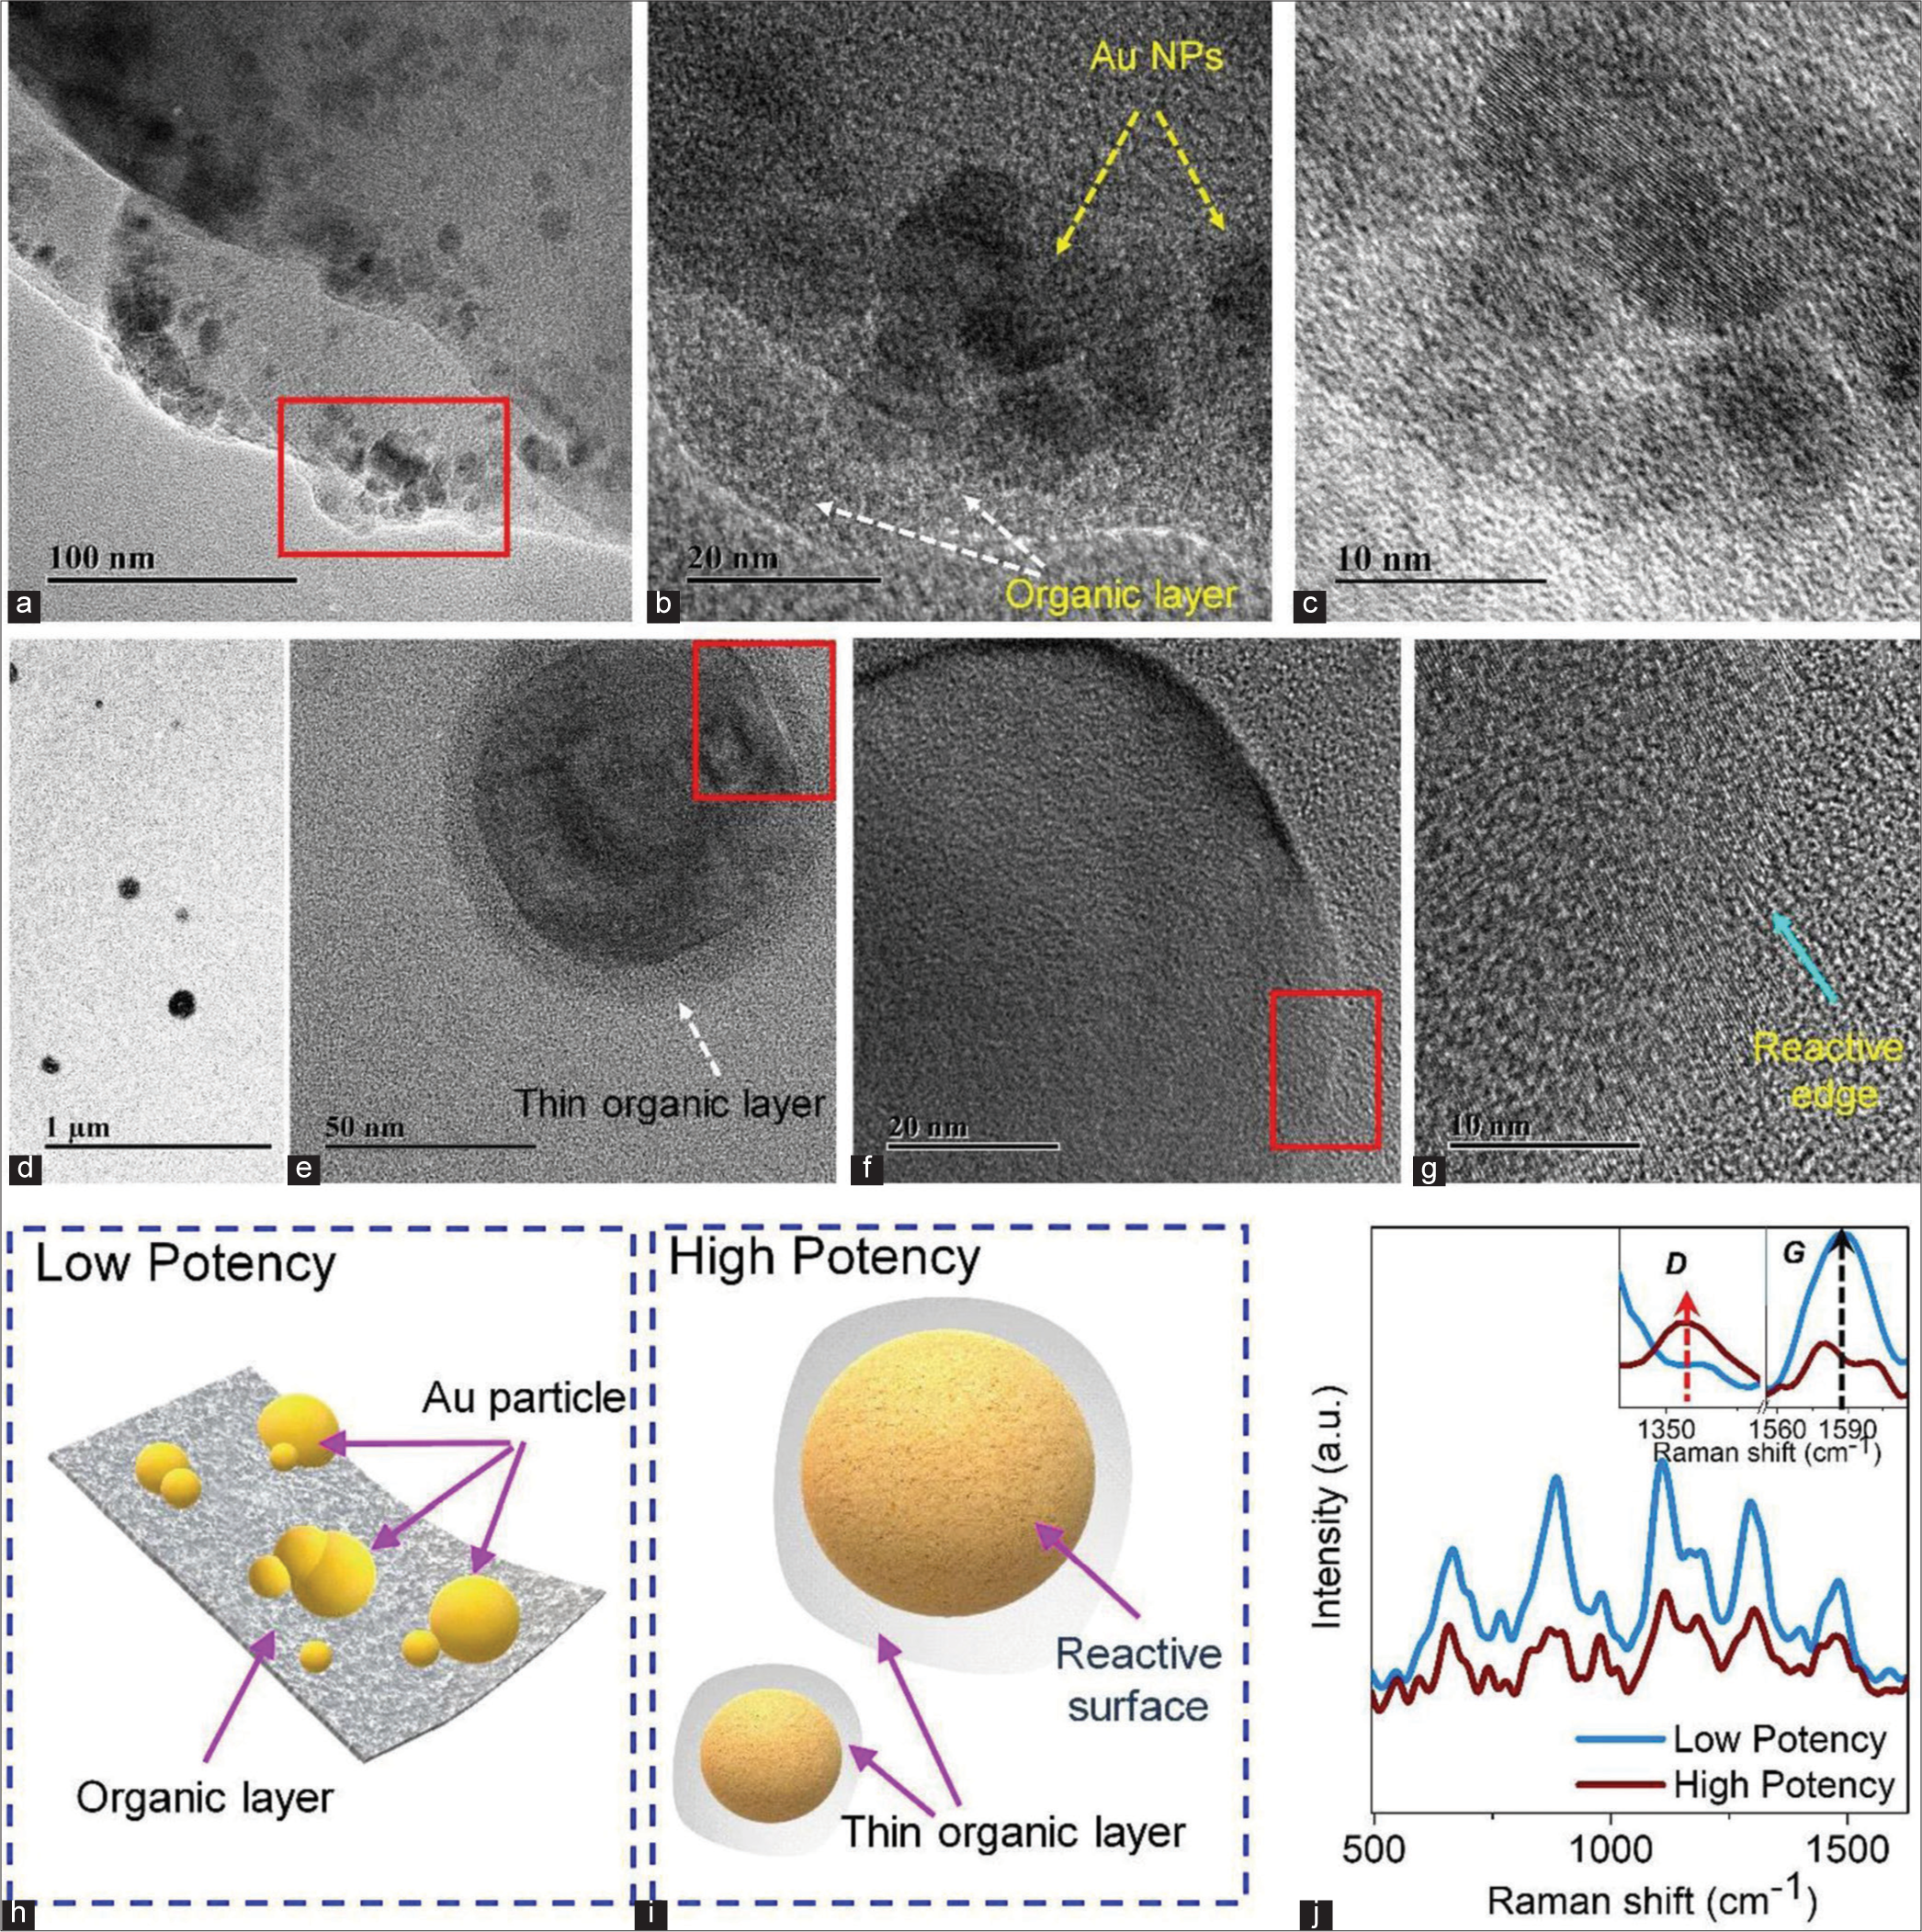
- (a) Transmission electron microscopy (TEM) image of a low potency sample. Red Square indicates presence of medicinal Au NPs in low potency. (b) High-resolution TEM (HRTEM) image of the sample. (c) HRTEM image of gold nanoparticles (Au NPs). (d) TEM image of high potency sample. (e) Single Au NPs with a thin layer at high potency. Red Square indicates presence of thin layer on the surface of Au NPs in high potency. (f) The enlarged portion of Figure e. Red Square indicates enlarged version of 6e and presence of reactive surface edges in high potency. (g) Reactive surface edge of Au nanoparticle. Schematic representation of (h) low potency and (i) high potency samples. (j) Raman spectra of both samples.
We would like to propose a numerical definition of the sample in a liquid medium so that our findings can be compared to the experimental data that are currently accessible. Our initial step was to study the interaction dynamics between Au NPs and the amorphous carbon (a-C) layer. We were able to analyse the dynamics of the interaction between the two by distributing Au NPs close to the a-C layer. Figure 7 shows the computational calculation of the interaction. Here, we observe that a-C was seen to interact with the Au NPs surface and causes a-C bond length increases with mean, µ = 0.033 Å and standard deviation, standard deviation (SD) = 0.05 Å [Figure 7]. To deepen our understanding of the interaction mechanism, we also calculate the mean interaction energy using the equation given below,
Moreover, we observed Einteraction = −25.901385 kcal/mol, where a negative value means a-C was binding to the surface of Au NPs cluster; EaC-Au = 116,041.185 kcal/mol, EAu = 6,316.252 kcal/mol, EaC = 109,750.834 kcal/mol. This suggests that within 0.1 ns, the addition of a-C interacts fast with the Au NPs surface, but this does not cause any breaking of the Au atoms bond and a-C bond. Further, we have studied the dynamics of the interaction of a-C and Au NPs with ethanol. Similar to the previous configuration, Au NPs and ethanol are dispersed close to the a-C. Further, we calculated using the interaction energy Equ-2 and found ~Einteraction = 403.83 kcal/mol, where a positive value signifies that a-C in ethanol was not binding to the surface of Au NPs. In addition, we calculate the other interaction energy, EaC-Au-ethanol = 116,064.761 kcal/mol, Eethanol = 27 kcal/mol, EAu-np = 109,248.187 kcal/mol, EaC = 6,385.741 kcal/mol
Figure 7 shows that the mean a-C bond length is μ =0.019, and the SD is ~0.04 due to the interaction between Au NPs. However, we observe a shift between two configurations, Δ mean = 0.014 Å and ΔSD = 0.01 Å, and this indicates the effect of a-C in the presence of ethanol.
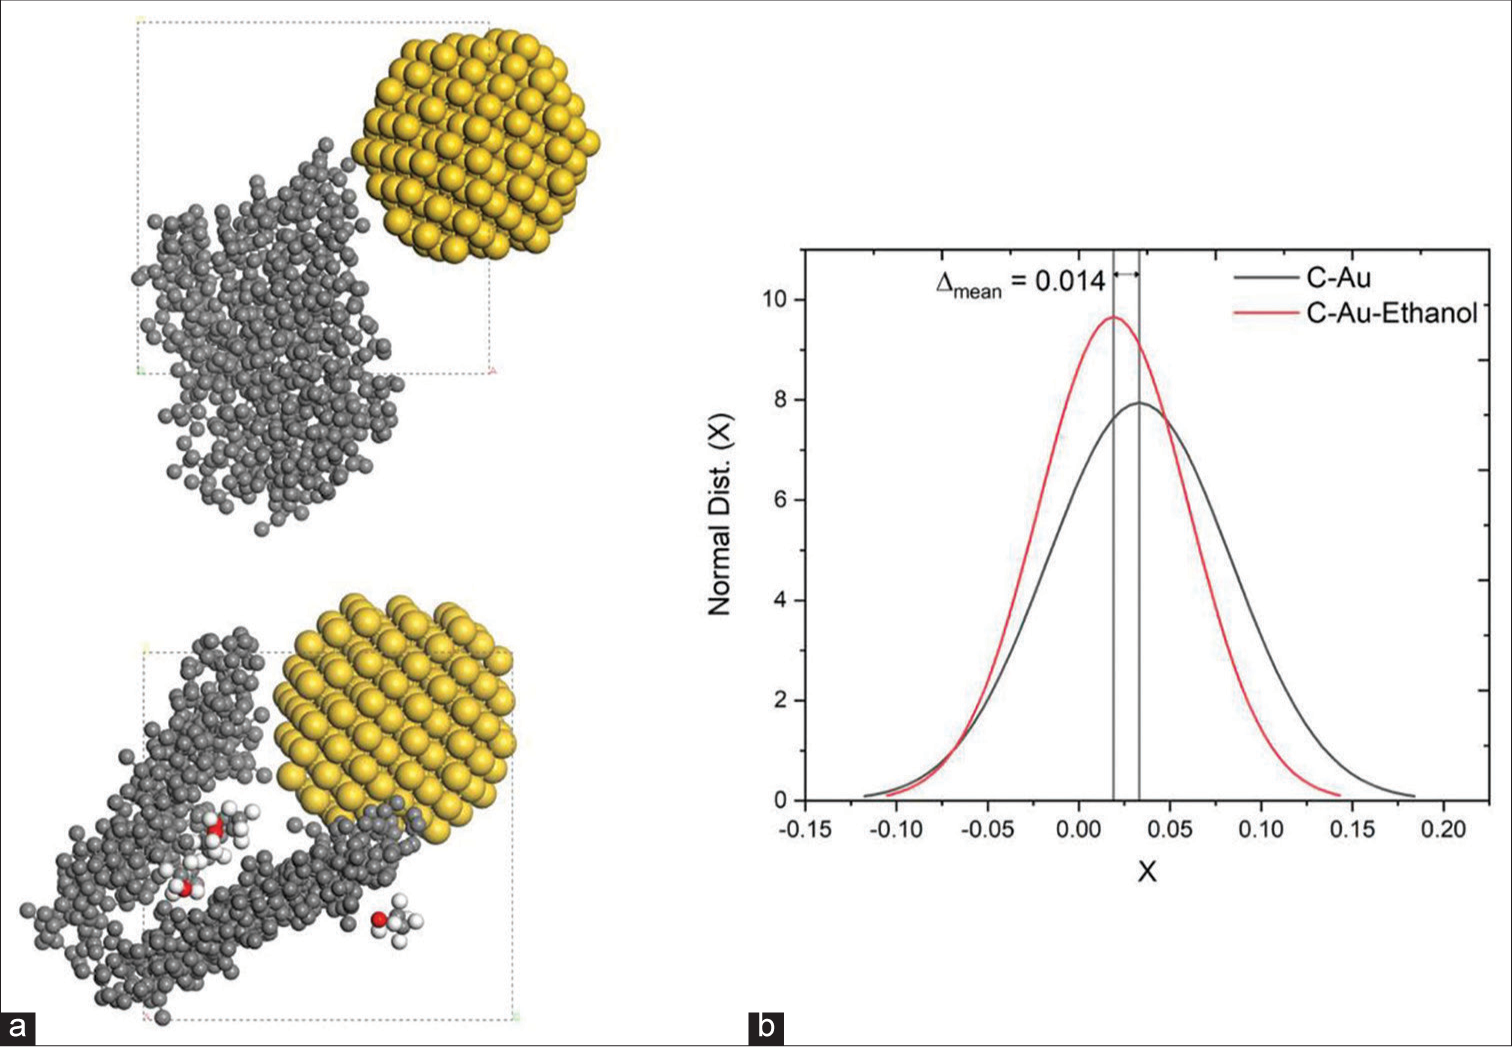
- (a) Amorphous C- Gold nanoparticles (Au NPs) Configuration (Left-Bottom) Amorphous C - Au NPs - Ethanol Configuration; Carbon is represented in the grey colour sphere, Gold in yellow, Hydrogen in White, Oxygen in Red; (b) Change in Bond length of Carbon distribution with interaction with Au nanocluster and with ethanol and Au NPs.
Tyndall effect of all diluted samples
Digital photographs of the sample (before and after succussion) are fully transparent at different potencies (6C, 50C and 200C). However, they show light scattering properties under laser beam excitation due to the Tyndall effect [Figure 8a-d]. The Tyndall effect confirms the presence of particles in the solution. For further analysis of the presence of air-bubble-particle, line scans were performed using ImageJ software, as shown in Figure 8b-d. Some spikes are noted, which are due to the presence of particles. The inset shows the digital photographs of the samples (before and after succussion) under Laser excitation. Interestingly, after succussion, drastic change is noted. The appearance of the new spikes indicates the formation of air-bubble-particle mixtures. The spike changes’ size and shape are associated with forming different size floated air-bubble-particle mixtures in the solution.[26,27]
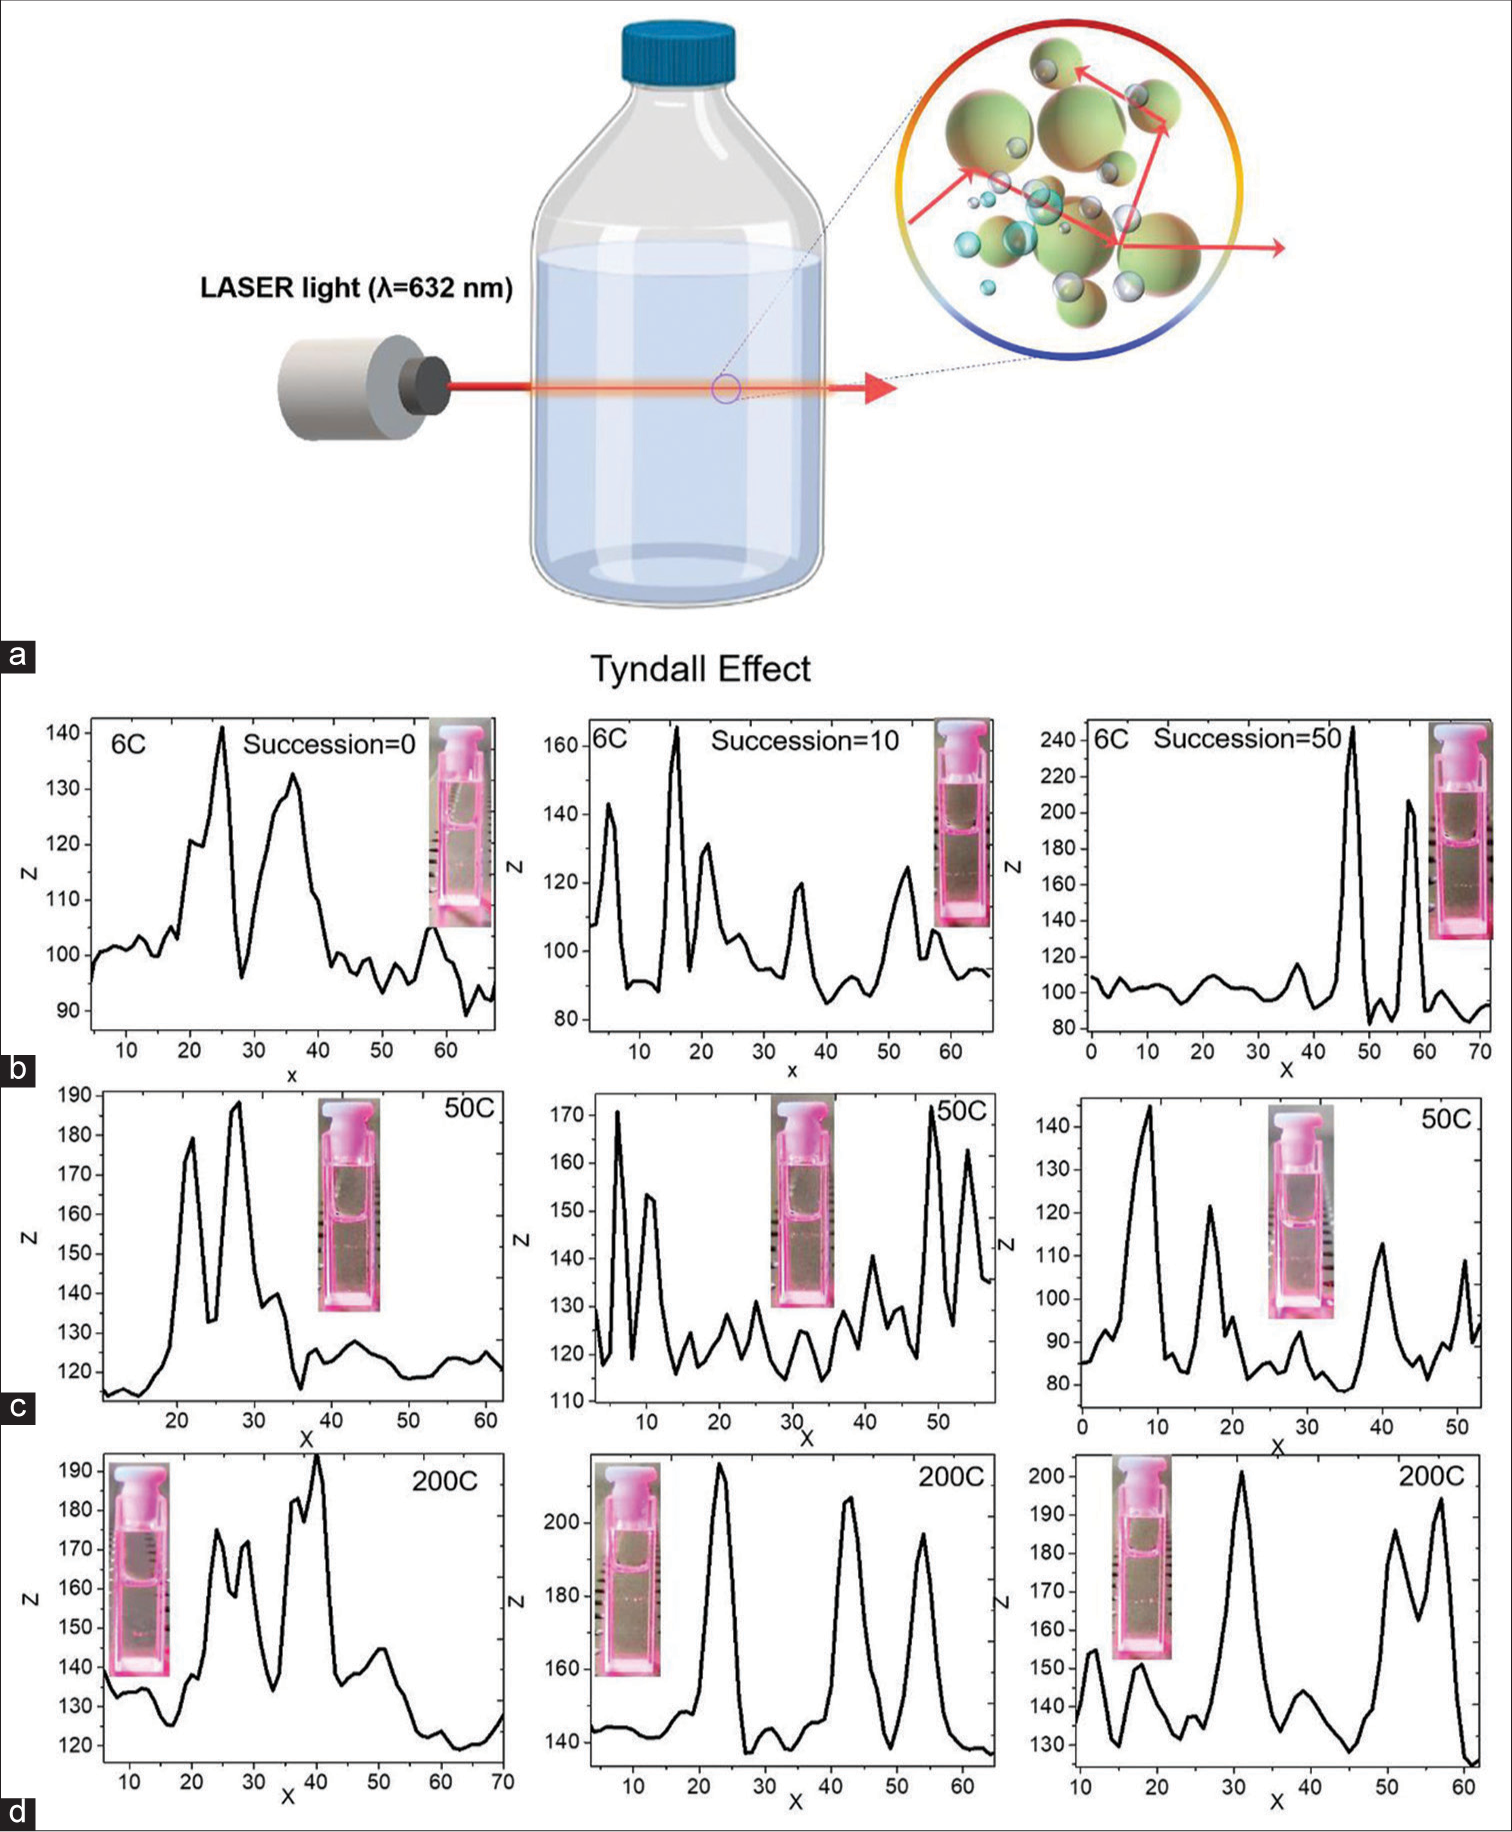
- (a) The schematic shows the Tyndall effect in a low-potency sample. Digital photographs with line scan profiles of the samples before and after succussion (b) 6C, (c) 50C and (d) 200C.
DISCUSSION
In this study, we combined Au with lactose to prepare the powder sample, which enabled a fine grind. After mechanical grinding, we incorporated Au particles and lactose combination powder. XRD measurement confirms the presence of Au particles (~2.6 nm crystallite size). We also observed a shift due to repeated mechanical grinding when mixing Au particles and lactose powder. The absorption characteristics of Au NPs are getting more prominent as the ratio of lactose and Au NPs gradually decreases. The higher potentization removes the lactose layer and exposes Au NPs. With repeated succussion in the solution, the layer disintegrates and moves away from the top of the NPs, exposing the surface.
The more surface these NPs expose, the more quickly they will react with human health and increase their medicinal effect. At low potency, a significant layer is generated from silicate and hydrocarbon, with Au NPs embedded in it. However, in the case of high potency, we observed that each particle is wrapped in a very thin layer instead of this layer. The surface of the NPs is more reactive as well. Therefore, this reactive surface of each particle can easily attach to the human organ and quickly cure diseases. Due to the insight offered by the proposed theory, we demonstrate that a thin layer of hydrocarbon is formed at high potency, and the Au NPs are embedded/encapsulated on that. However, after trituration, the layer forms a thin coating on every NP. The expected pattern is in excellent agreement with our experimental findings, where it was revealed that the formation of the outermost layer was influenced by interactions that were more potent and helped to increase efficiency. Traditional homoeopathy medicine is formed from the lactose and metal particles. Our significant observation from TEM images is the formation of thin layer of hydrocarbon coating confirmed using Raman analysis. Therefore, it is observed that a layer of hydrocarbon and silicate is formed at lower potency, and the Au NPs are embedded/encapsulated on that. However, after trituration, the layer may disintegrate and form a thin coating on every NPs. The theoretical analysis, further, supports the experimental observation. The interaction energy between carbon layer and the NPs is also estimated which provides meaningful insight into the formation of thin layer of coating. Raman analysis shows that the D band and G band of carbon have been created, and their intensity has changed with potency. Therefore, we can conclude that on more dilution, the properties of NPs become more prominent, and the dominance of lactose is considerably reduced.
Simultaneously, when we shake it repeatedly, the layer of lactose is removed from the surface of the NPs, and these are exposed. Thus, the NPs are more capable of working on human health. In addition, the Tyndall effect shows the increase of particles with succussion. The particle size increases because more water bubbles are formed and attached to NPs. This is why homoeopathic medicines need to be shaken repeatedly before taking them to make them more effective. We may conclude that higher potencies of Aurum met express dynamic action in the presence of NPs. In the drug-delivery system, the agglomeration and clustering of NPs have a wide range of applications. In homoeopathy medicine, this agglomeration and clustering have an enormous effect due to the presence of NPs.
CONCLUSION
We have studied the effect of ultra-low dilution (up to 10200 times) of Aurum met (Au NPs colloidal), revealing the mechanism of colloidal formation in such extreme dilution. XRD and Spectroscopy measurement shows that the solution contains Au NPs with different size distributions. TEM analysis confirms that the higher potentization removes the silicate-hydrocarbon layer and exposes Au NPs and the surface. Theoretical calculations provide more effective, transferrable and understandable agreement for the interaction of Au NPs and the carbon layer. Therefore, this reactive surface of each particle can easily attach to the human organ systems and effectively cure diseases. In higher potency, the surface energy of NPs, particle-particle interaction, ionic strength and uniform distribution determine the effectiveness in several applications. The processing in different materials (glass and polymer) container confirms the formation of silica particles in glass vessels. Thus, we believe that this work provides a new pathway for future applications in the drug delivery system.
Highlights
In higher potency, surface of the nanoparticles is more reactive. Nanoparticles are formed during the trituration process in Homoeopathy. The distribution of the particles changes as a function of potency. Nanoparticles are encapsulated with a thin organic layer of hydrocarbons and silicates. Theoretical calculations comprehend the formation of a thin hydrocarbon layer at higher potencies.
Ethical approval
The Institutional Review Board approval is not required.
Declaration of patient consent
Patient’s consent are not required as there are no patients in this study.
Conflicts of interest
There are no conflicts of interest.
Use of artificial intelligence (AI)-assisted technology for manuscript preparation
The authors confirm that there was no use of artificial intelligence (AI)-assisted technology for assisting in the writing or editing of the manuscript and no images were manipulated using AI.
Financial support and sponsorship
Nil.
References
- Applications of colloidal inorganic nanoparticles: From medicine to energy. J Am Chem Soc. 2012;134:15607-20.
- [CrossRef] [PubMed] [Google Scholar]
- Robust ligand shells for biological applications of gold nanoparticles. Langmuir. 2008;24:13572-80.
- [CrossRef] [PubMed] [Google Scholar]
- Calculated absorption and scattering properties of gold nanoparticles of different size, shape, and composition: Applications in biological imaging and biomedicine. J Phys Chem B. 2006;110:7238-48.
- [CrossRef] [PubMed] [Google Scholar]
- Colloidal gold nanoparticles as catalyst for carbon-carbon bond formation: Application to aerobic homocoupling of phenylboronic acid in water. Langmuir. 2004;20:11293-6.
- [CrossRef] [PubMed] [Google Scholar]
- Atomically precise colloidal metal nanoclusters and nanoparticles: Fundamentals and opportunities. Chem Rev. 2016;116:10346-413.
- [CrossRef] [PubMed] [Google Scholar]
- Extreme homeopathic dilutions retain starting materials: A nanoparticulate perspective. Homeopathy. 2010;99:231-42.
- [CrossRef] [PubMed] [Google Scholar]
- Dilution-induced physico-chemical changes of metal oxide nanoparticles due to homeopathic preparation steps of trituration and succussion. Homeopathy. 2020;109:65-78.
- [CrossRef] [PubMed] [Google Scholar]
- Encapsulated plant extract (Gelsemium sempervirens) poly (lactide-coglycolide) nanoparticles enhance cellular uptake and increase bioactivity in vitro. Exp Biol Med. 2010;235:678-88.
- [CrossRef] [PubMed] [Google Scholar]
- Metal nanoparticle induced hormetic activation: A novel mechanism of homeopathic medicines. Homeopathy. 2017;106:135-44.
- [CrossRef] [PubMed] [Google Scholar]
- Nanoparticle characterisation of traditional homeopathically manufactured cuprum metallicum and Gelsemium sempervirens medicines and controls. Homeopathy. 2019;108:73-4.
- [CrossRef] [PubMed] [Google Scholar]
- A review of basic research on homoeopathy from a physicist's point of view. Indian J Res Homoeopathy. 2015;9:141-51.
- [CrossRef] [Google Scholar]
- Homeopathy emerging as nanomedicine. Int J High Dilution Res. 2011;10:299-310.
- [CrossRef] [Google Scholar]
- Homeopathy is seen as personalised nanomedicine. Homeopathy. 2019;108:66-70.
- [CrossRef] [PubMed] [Google Scholar]
- Adaptive network nanomedicine: An integrated model for homoeopathic medicine. Front Biosci. 2013;5:685-708.
- [CrossRef] [PubMed] [Google Scholar]
- Enhancement of adaptive biological effects by nanotechnology preparation methods in homoeopathic medicines. Homeopathy. 2015;104:123-38.
- [CrossRef] [PubMed] [Google Scholar]
- Homoeopathic Pharmacopoeia of India (HPI) Available from: https://abfh.org.br/wp-content/uploads/2017/03/hpicombind-volume-i-v [Last accessed on 2023 Jun 30]
- [Google Scholar]
- Materia medica In: The encyclopedia of pure materia medica: A record of the positive effects of drugs upon the healthy human organism. Vol 2. New York: American Foundation for Homoeopathy; 1874. p. :1. Available from: https://resource.nlm.nih.gov/64240040R [Last accessed on 2023 Jun 30]
- [Google Scholar]
- Au nanoparticle monolayers covered with sol-gel oxide thin films: Optical and morphological study. Langmuir. 2011;27:13739-47.
- [CrossRef] [PubMed] [Google Scholar]
- Observation of high photocatalytic activity by tuning of defects in chemically synthesized ethylene glycol capped ZnO nanorods. Optik. 2018;154:303-14.
- [CrossRef] [Google Scholar]
- Why extreme dilutions reach non-zero asymptotes: A nanoparticulate hypothesis based on froth flotation. Langmuir. 2012;28:15864-75.
- [CrossRef] [PubMed] [Google Scholar]
- The optical properties of metal nanoparticles: The influence of size, shape, and dielectric environment. J Phys Chem B. 2003;107:668-77.
- [CrossRef] [Google Scholar]
- Luminescent carbon quantum dots with high quantum yield as a single white converter for white light emitting diodes. Appl Phys Lett. 2015;107:213102.
- [CrossRef] [Google Scholar]
- Hydrothermal route for cutting graphene sheets into blue-luminescent graphene quantum dots. Adv Mater. 2010;22:734-8.
- [CrossRef] [PubMed] [Google Scholar]
- Rapid analysis of glucose, fructose and sucrose contents of commercial soft drinks using Raman spectroscopy. Food Control. 2015;48:56-61.
- [CrossRef] [Google Scholar]
- Direct molecule-specific glucose detection by Raman spectroscopy based on photonic crystal fibre. Anal Bioanal Chem. 2012;402:687-91.
- [CrossRef] [PubMed] [Google Scholar]
- Temporal dynamics of the scattering properties of deionized water. Phys Wave Phen. 2020;28:135-9.
- [CrossRef] [Google Scholar]
- Evidence of the existence and the stability of nano-bubbles in water. Colloids Surf A. 2010;361:31-7.
- [CrossRef] [Google Scholar]
SUPPLEMENTARY FILE
EXPERIMENTAL DETAILS
Synthesis of sample
The Gold with 99.9 purity was used for the preparation of Aurum Metallicum (Aurum Met). The sample was prepared in a glass vial as well as in a plastic vial following the standard protocol of Homoeopathic Pharmacopoeia, India. The sample and procedure were performed in the HAPCO Pharmaceutical laboratory.
Preparation of Aurum Met 1X by trituration
5g of Gold (Power form-Dark Yellow, fine) mixed with 45 g of Sugar of Milk (80 mess) (Lactose) in the following procedure:
Divide the sugar milk into 3 parts in a ratio of 1:3:5 (5 g + 15 g + 25 g) and 5 g of Gold mixed with one portion (5 g) of sugar milk in mortar and pestle by 20 min (5 min +5 min + 5 min + 5 min). Each 5 min consists of 90 s grinding and 60 s scrapping. The above portion was mixed with the Second portion (15 g) of sugar of milk in a mortar and pestle for 20 min (10 min + 10 min). Each 10 min consists of 6 min grinding and 4 min scrapping. The above portion was mixed with the third portion (25 g) of sugar of milk in a mortar and pestle for 20 minutes (10 min + 10 min. Each 10 min consists of 6 min grinding and 4 min scrapping.
The 50 g of Aurum Met 1X has been prepared by the above methods.
Preparation of Aurum Met 2X by trituration
The 50 g of Aurum Met 1X mixed with 450 g of Sugar of Milk (80 mess) (Lactose) in the following procedure:
Divide the sugar of milk into two parts (50 g + 400 g) and 50 g of Aurum Met 1X mixed with one portion (50 g) of sugar of milk and grind for 5 min. Add the second portion (400 g) of sugar milk with the above portion and grind for 55 min. The total duration of the above procedure consists of 1 hour.
The 500 g of Aurum Met 2X has been prepared by the above methods.
Preparation of Aurum Met 3X by trituration
Aurum Met 2X (100 g) mixed with 900 g of Sugar of Milk (80 mess) (Lactose) in the following procedure:
Divide the Sugar of Milk into two parts (100 g and 800 g)
100 g of Aurum Met 1X mixed with one portion (50 g) of sugar milk and grinding for 5 min. Add the second portion (800 g) of sugar milk along with the above portion and grind for 55 min. The total duration of the above procedure consists of 1 h. The 1000 g of Aurum Met 3X has been prepared by the above methods.
Preparation of Aurum Met 4X, 5X and 6X by trituration
The Aurum Met 4X, 5X and 6X are prepared like a procedure of Aurum Met 3X from previous decimal potency with the exception that the sugar of milk-200 mess will be used instead of 80 mess from Aurum Met 4X from 5X to 6X.
Preparation of Aurum Met liquid potency
The liquid potency of Aurum Met can be prepared by the following procedure:
0.17 g/170 mg of Aurum Met 6X mixed with 8.5 mL of distilled water and 8.5 mL of dispensing alcohol (17 mL). The preparation was kept for 30 min or till power dissolved, followed by adding 8.5 mL of Dilute alcohol in the above solution. The solution is provided by ten strokes (manual with up to the peak of the shoulder).
The procedure makes the Aurum Met power form into liquid form (Aurum Met 6X converted into Aurum Met 4C).
Preparation of Aurum Met 5C
Eight drops of Aurum Met 4C mixed with 17 mL of dilute alcohol and solution are provided by ten strokes (manual with up to the peak of the shoulder), leading to the preparation of 10 mL of Aurum Met 5C.
Preparation of Aurum Met 6C
1 mL of Aurum Met 5C mixed with 99 mL of dispensing alcohol and solution are provided by ten strokes (manual with up to the peak of the shoulder) leads to the preparation of 100 mL of Aurum Met 6C.
Preparation of Aurum Met 7C
Three drops of Aurum Met 6C mixed with 6.8 mL of Dispensing Alcohol and solution are provided by ten strokes (manual with up to the peak of the shoulder), leading to the preparation of 10 mL of Aurum Met 7C.
Preparation of further potencies up to Aurum Met 200C
Three drops of Aurum Met previous potencies mixed with 6.8 mL of Dispensing Alcohol and solution are provided by ten strokes (manual with up to the peak of the shoulder), leading to the preparation of 10 mL of Aurum Met liquid potencies up to 200C.
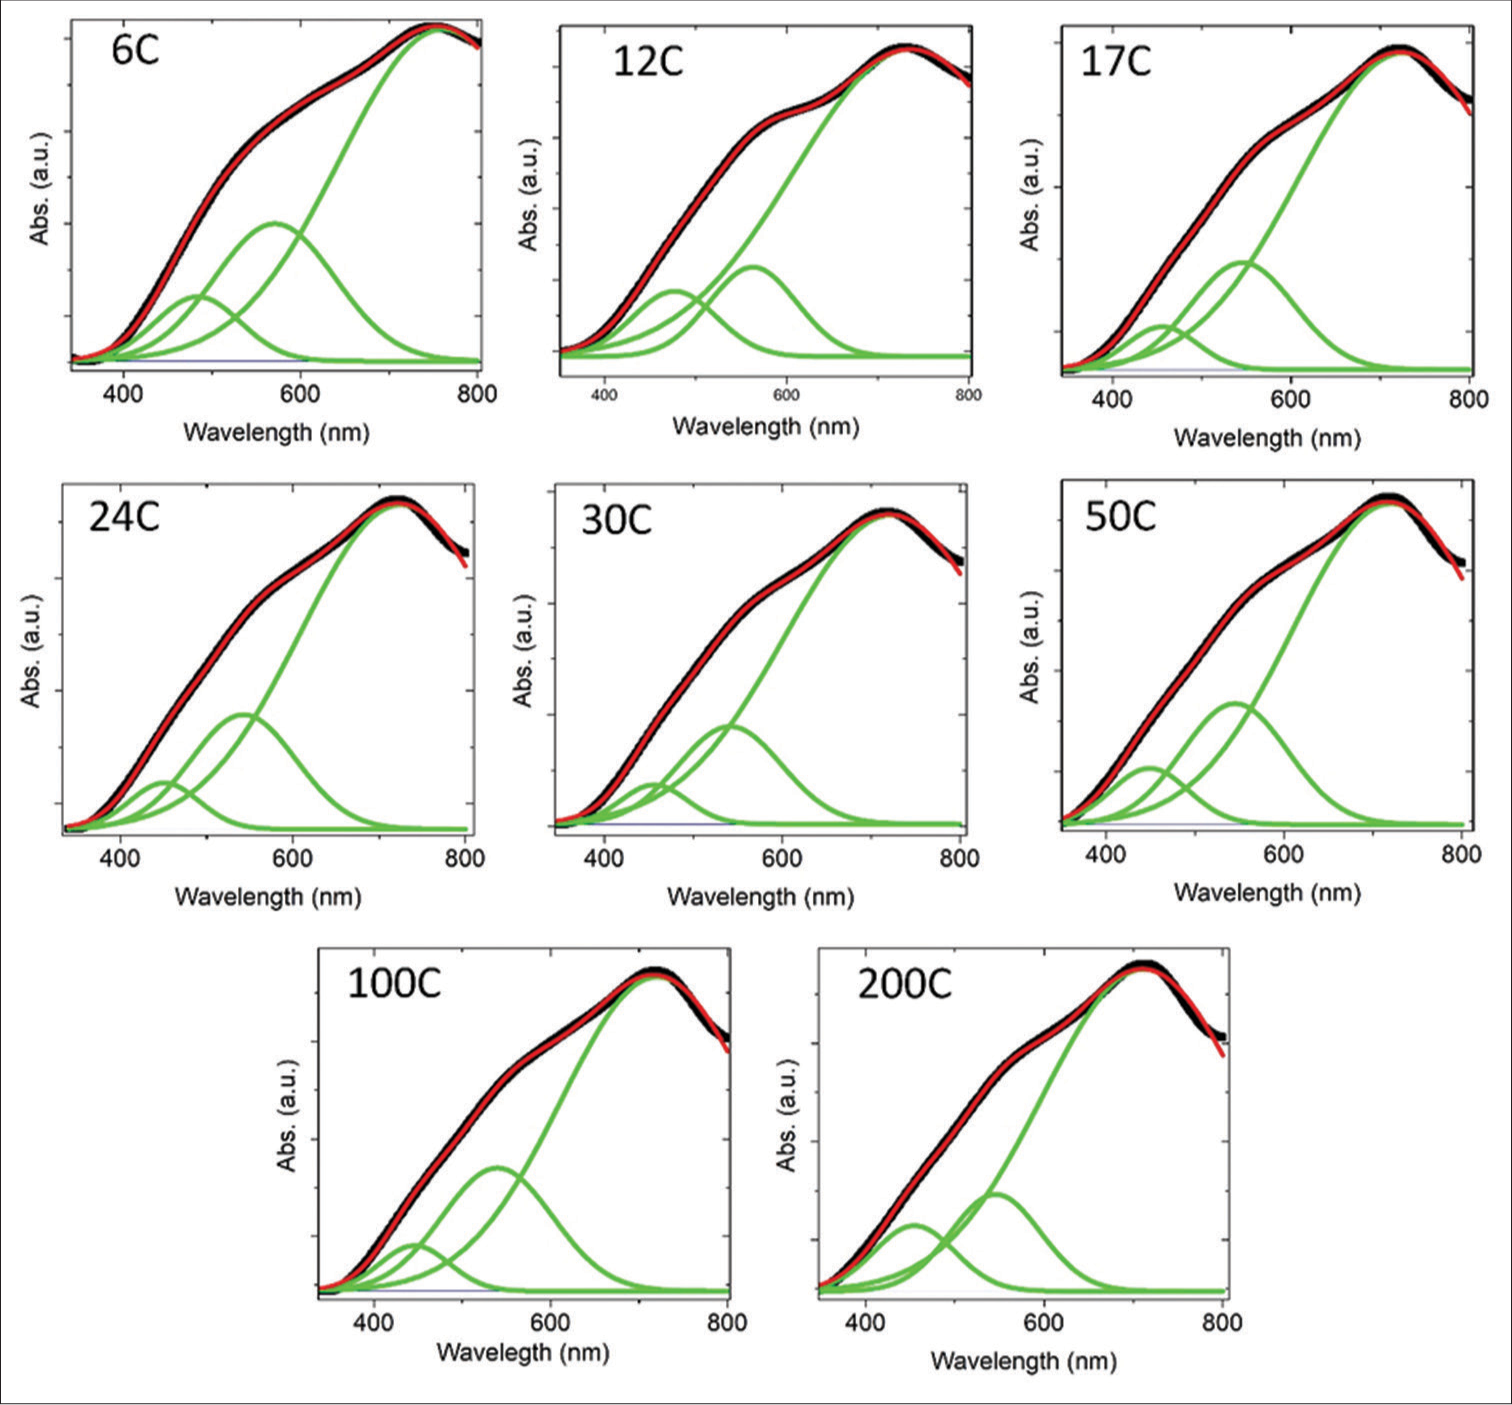
- Gaussian fittings of absorption spectra of different diluted samples. S1 indicate baseline corrected fitted absorption spectra with three Gaussian peaks of different potency of aurum metallicum (6C,12C,17C,24C,30C, 50C, 100C and 200c)
- Ultraviolet-visible absorption spectra of plastic bottle samples.
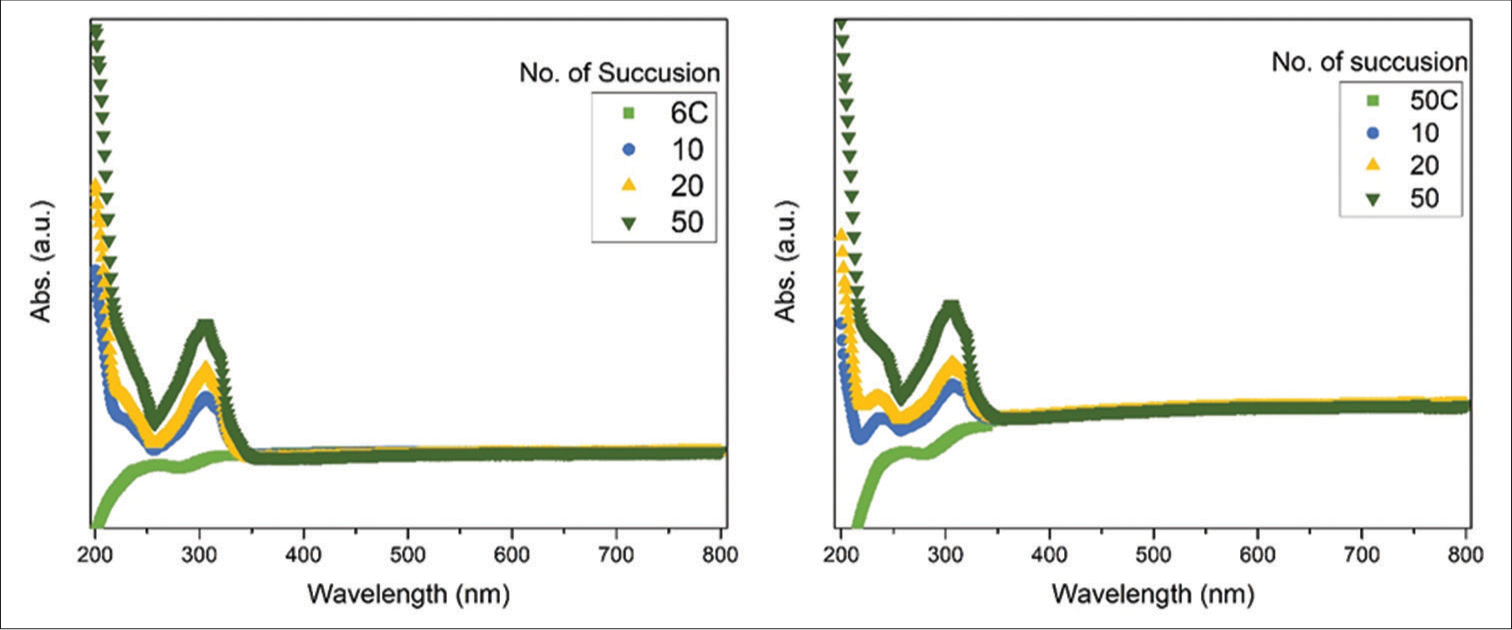
- Ultraviolet-visible absorption spectra of different dilution samples after succussions.